
Love Bird · Season 10 · environment pipeline

Two lanes, one shot.
Same plate. Same prompt. Same 5 seconds.

The opening scout clip took 537 seconds of billed GPU to produce five seconds of video. That was never generation time — it was a 98 GB model download, repaid from scratch on every cold worker. This page puts the two candidate lanes side by side on the identical shot so the choice is made on measured numbers.

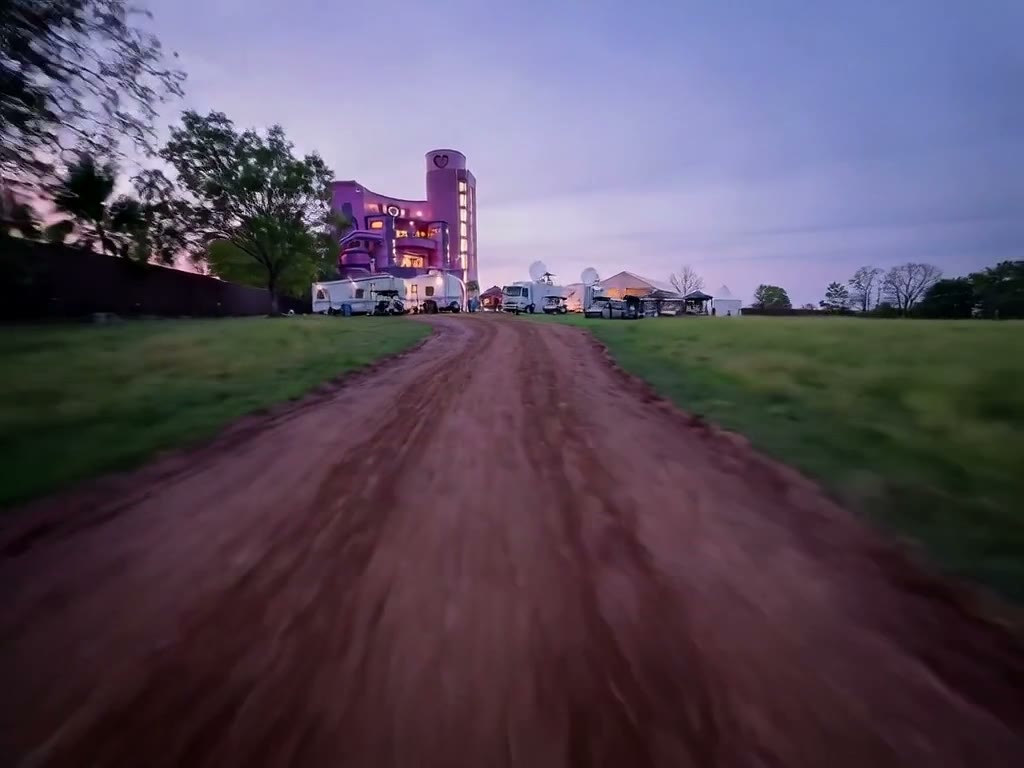
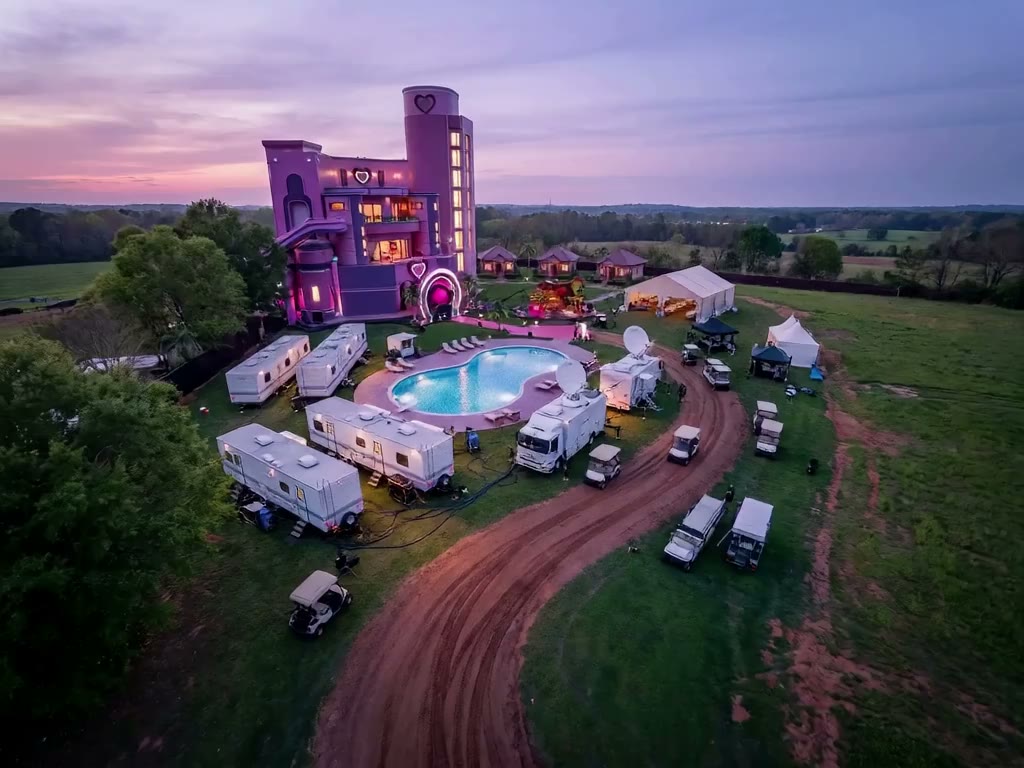
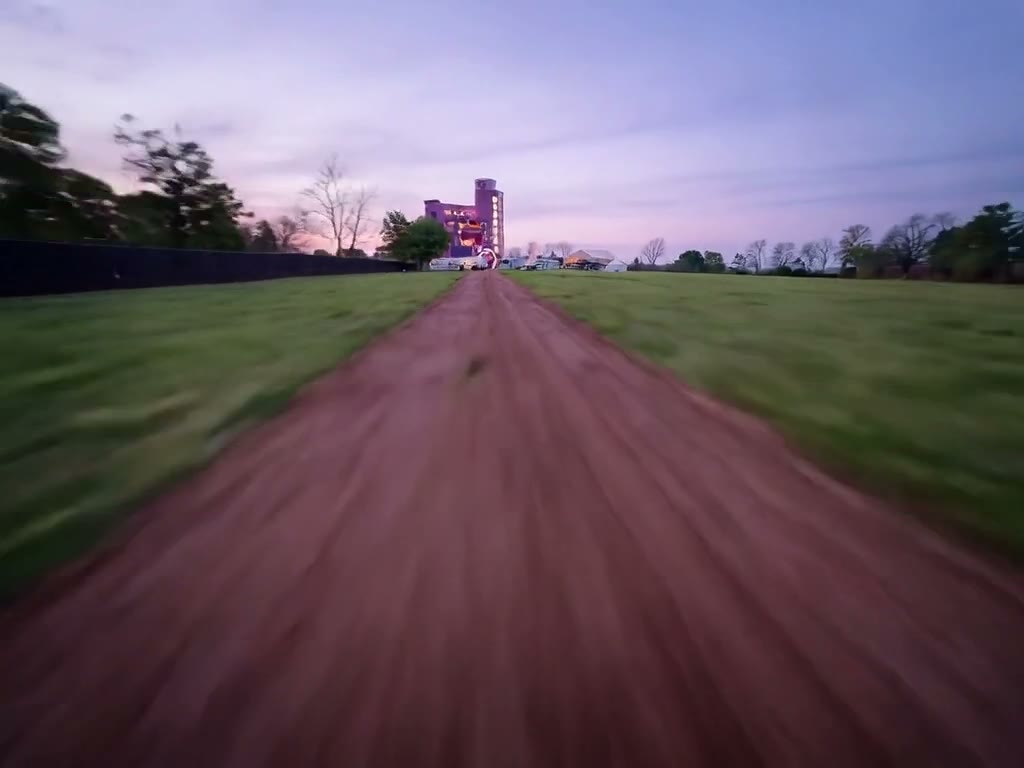
The shotDeparting the locked master plate

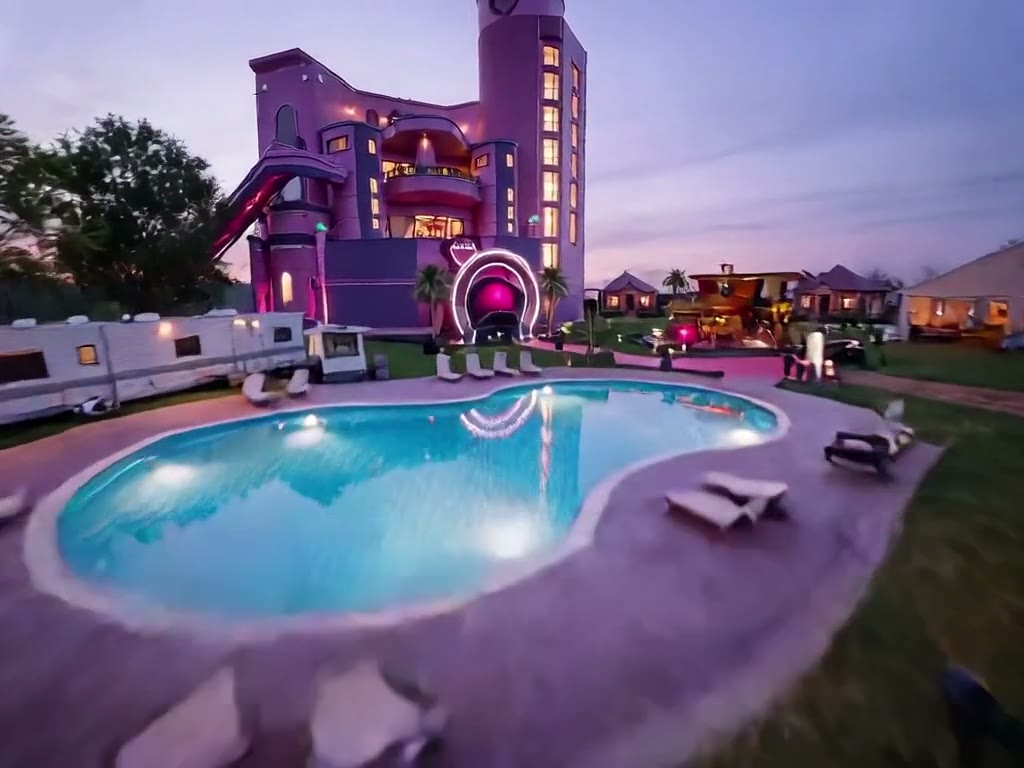
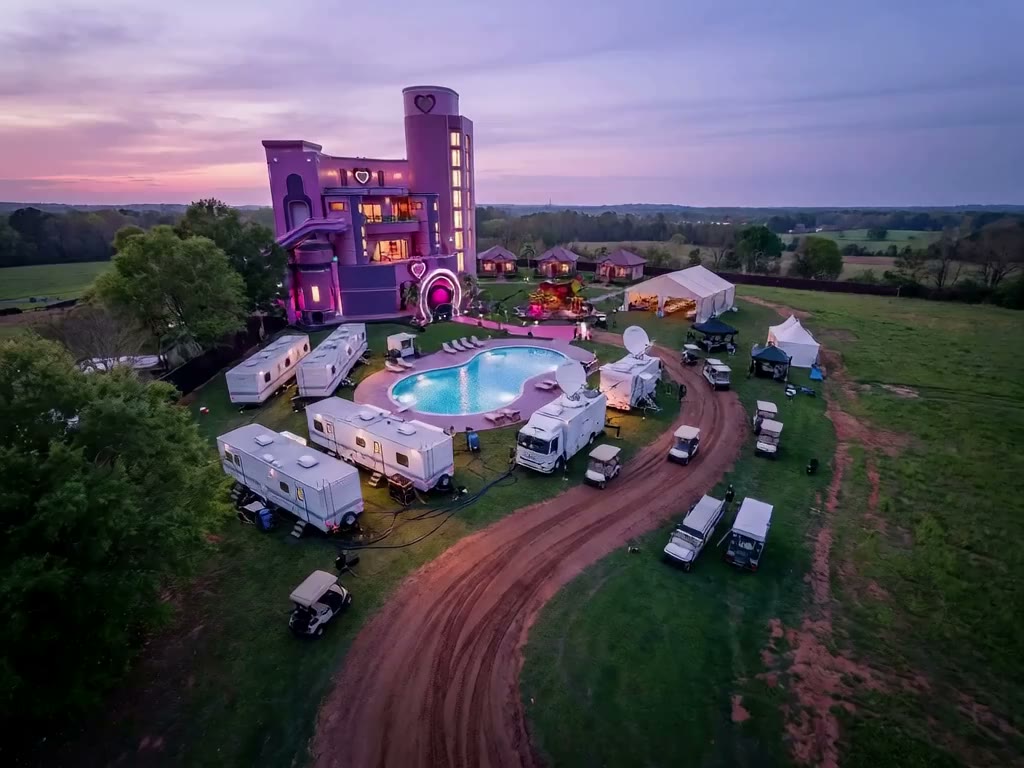
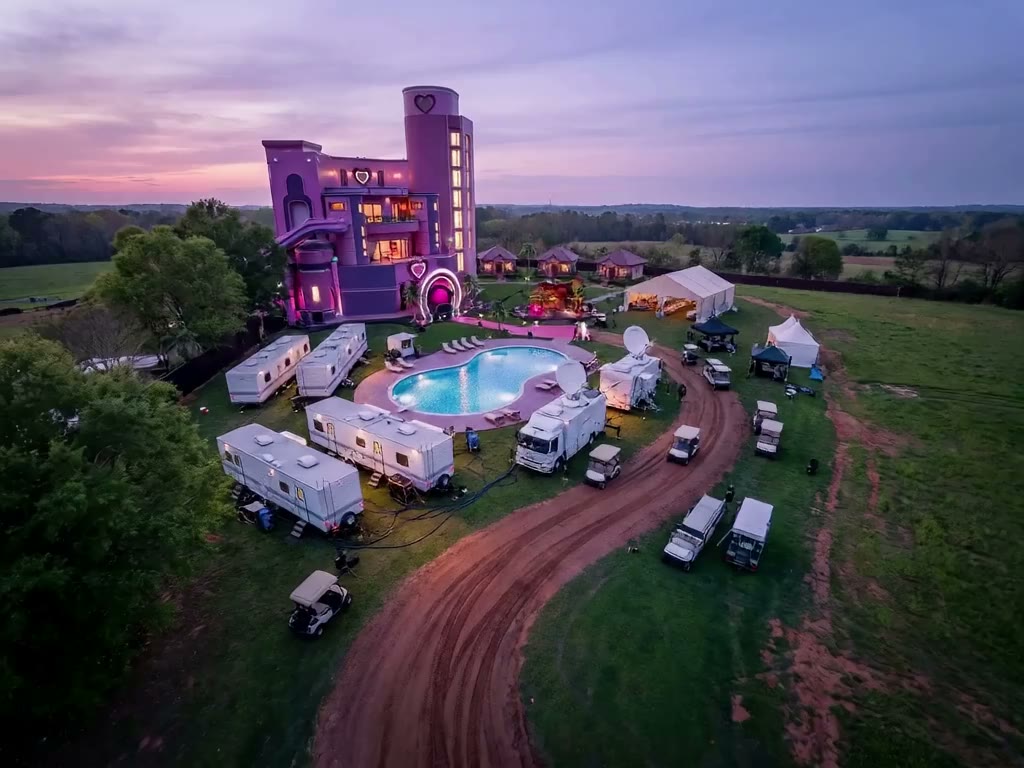
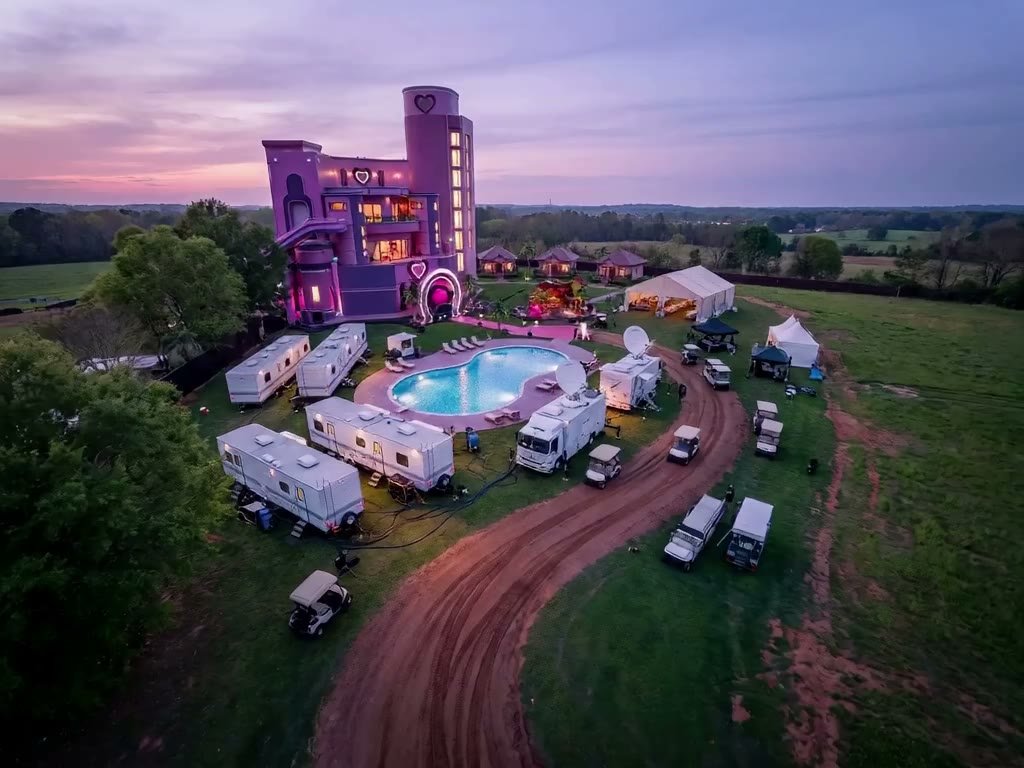
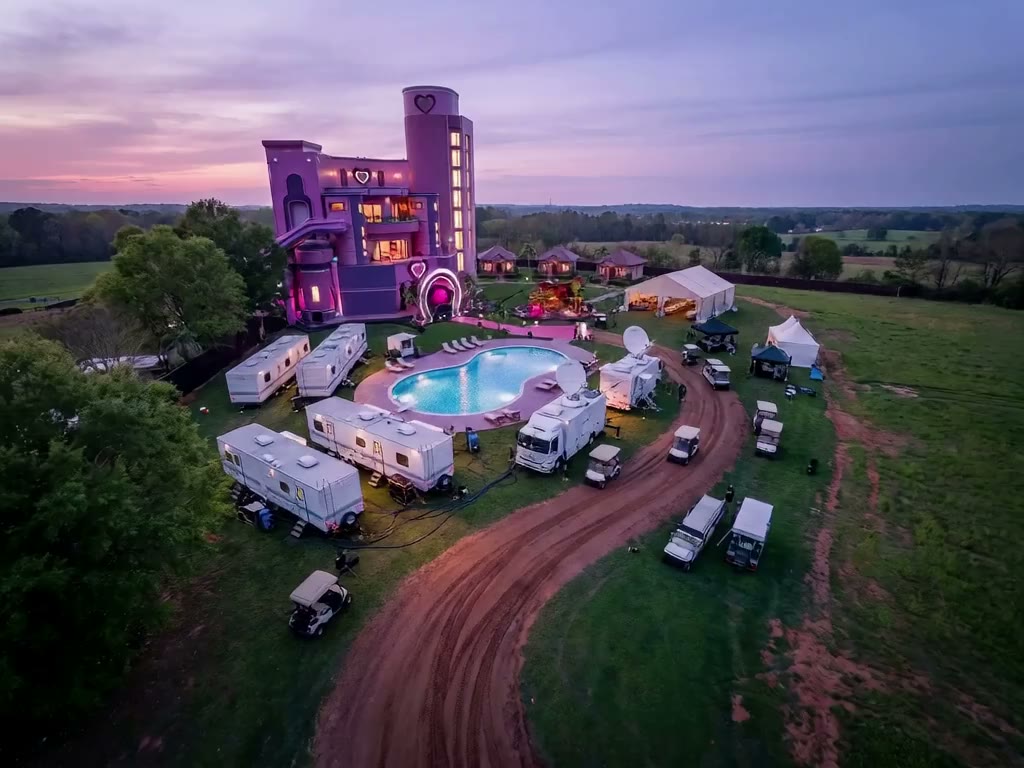
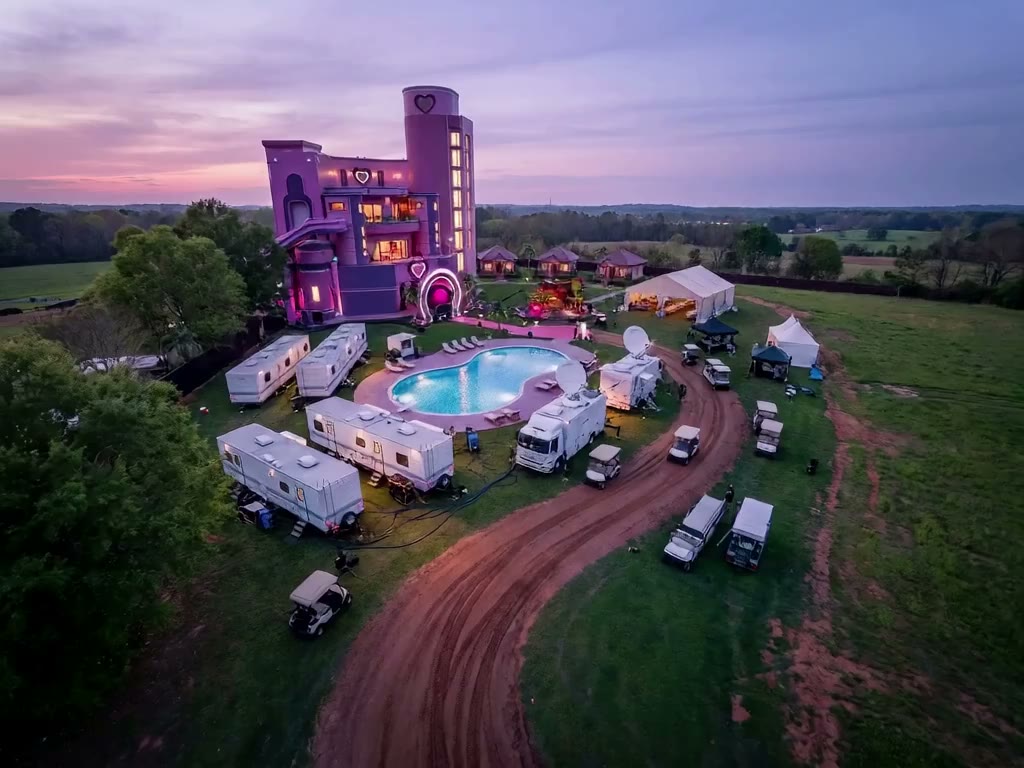
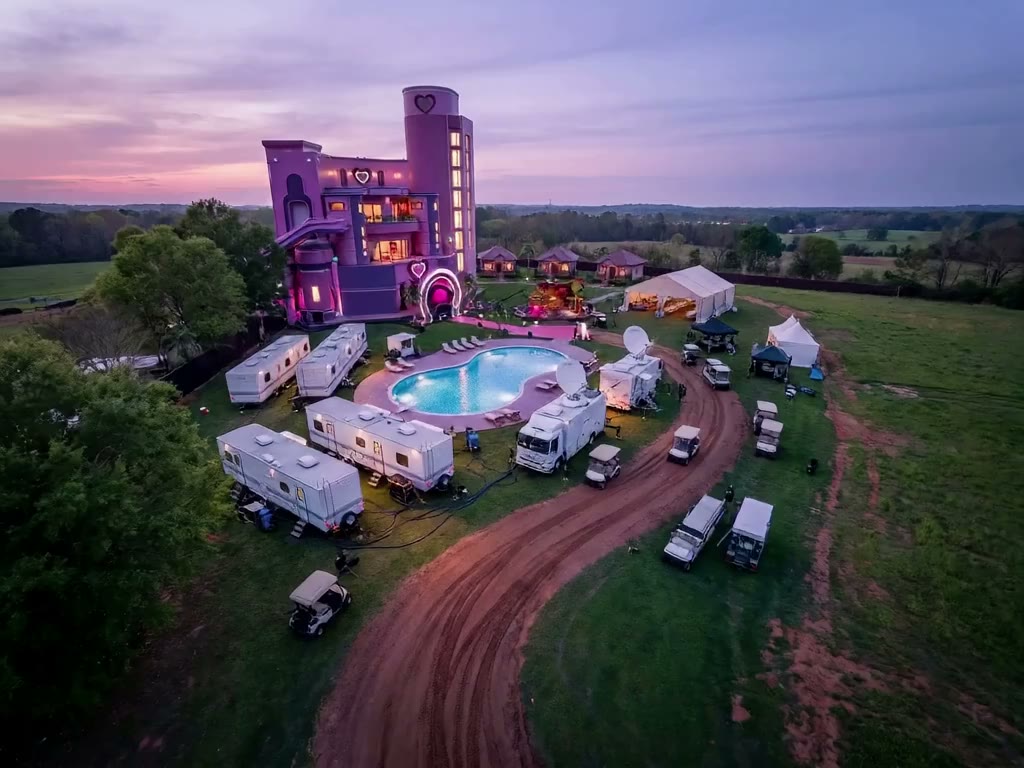
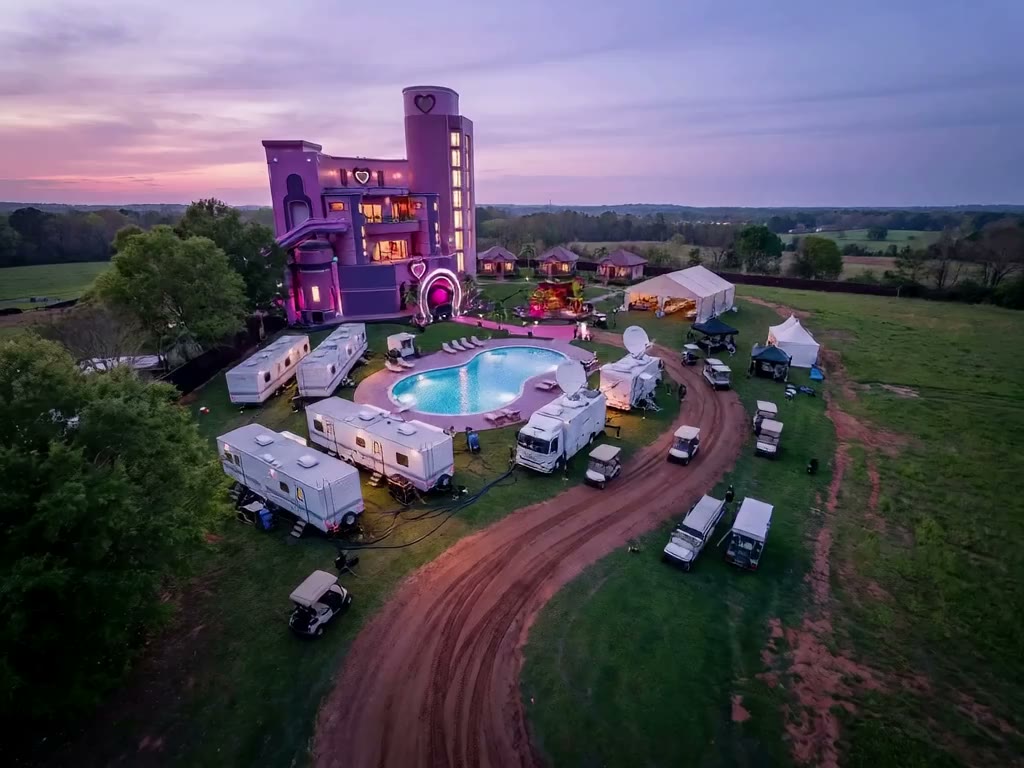
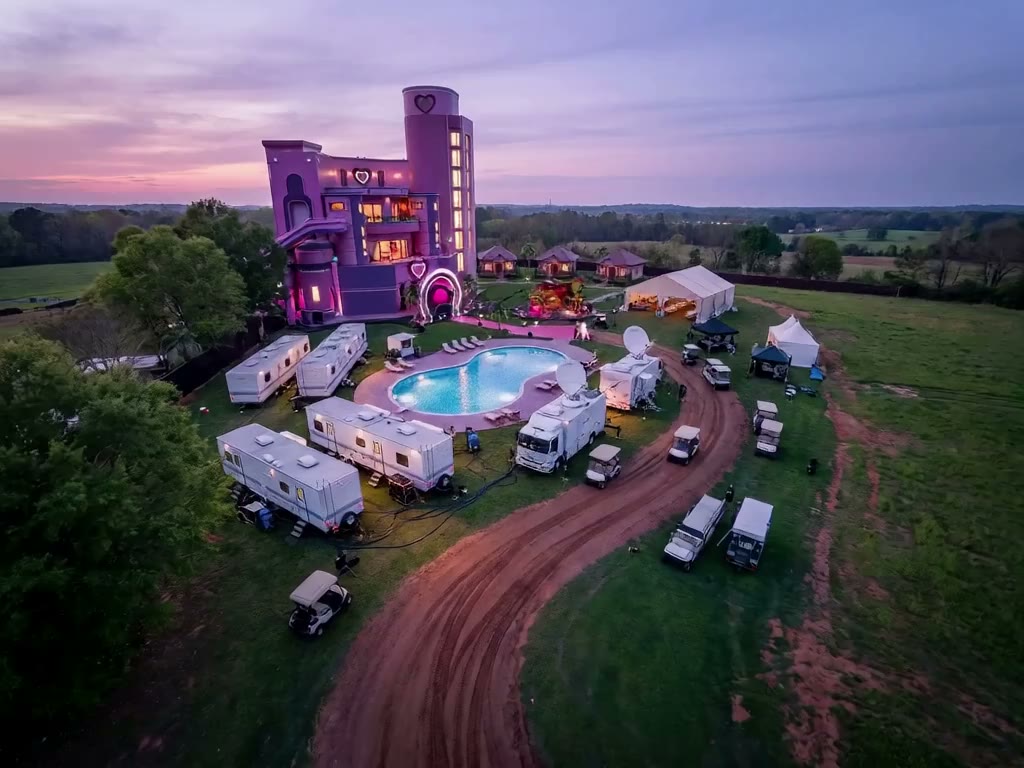
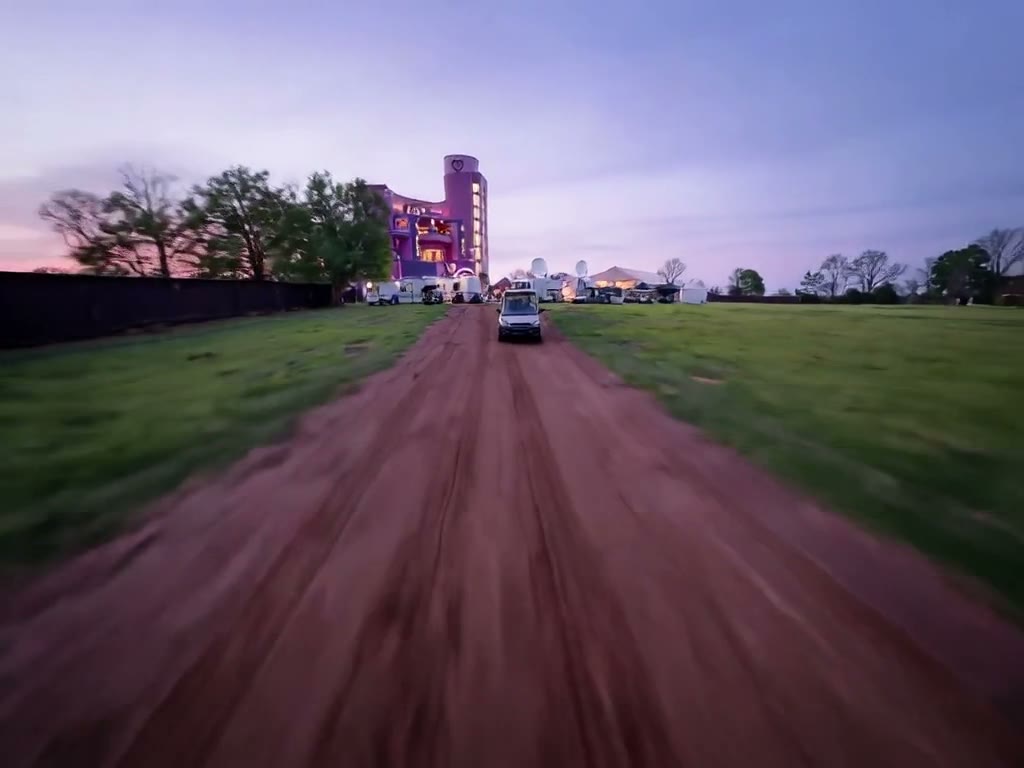
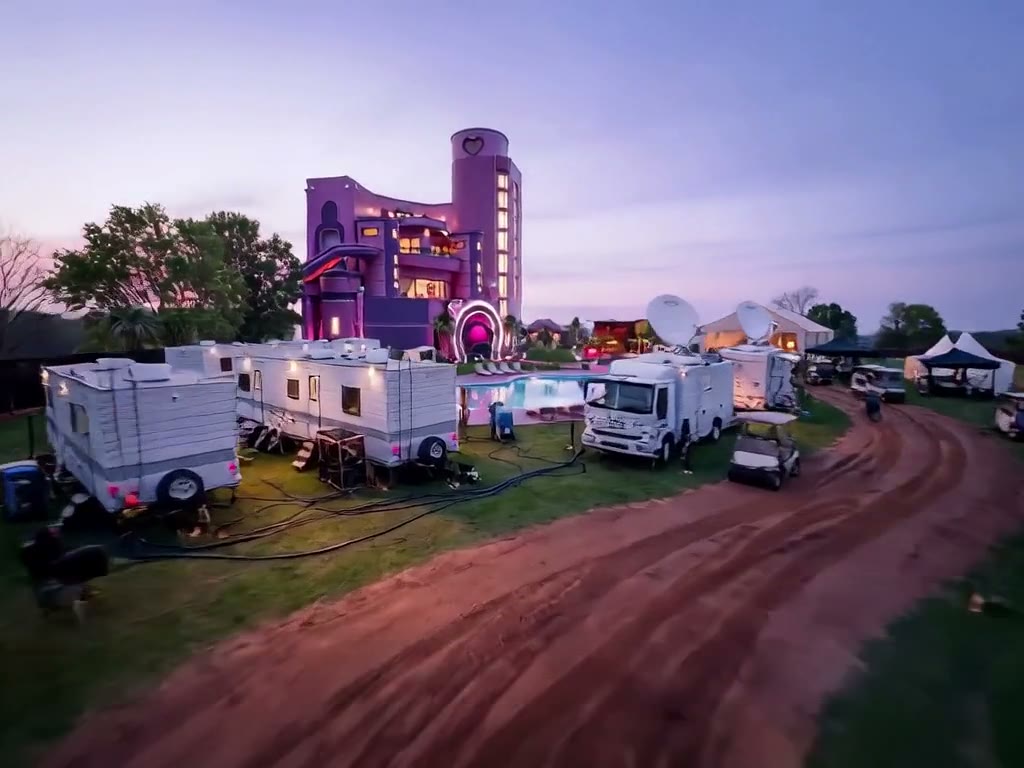
Composer environment 1ba70902, locked people-free master plate f6c6d570. Source is 2400×1792 — a 4:3 frame, resized proportionally to 1024×768. Never stretched, never relabelled.

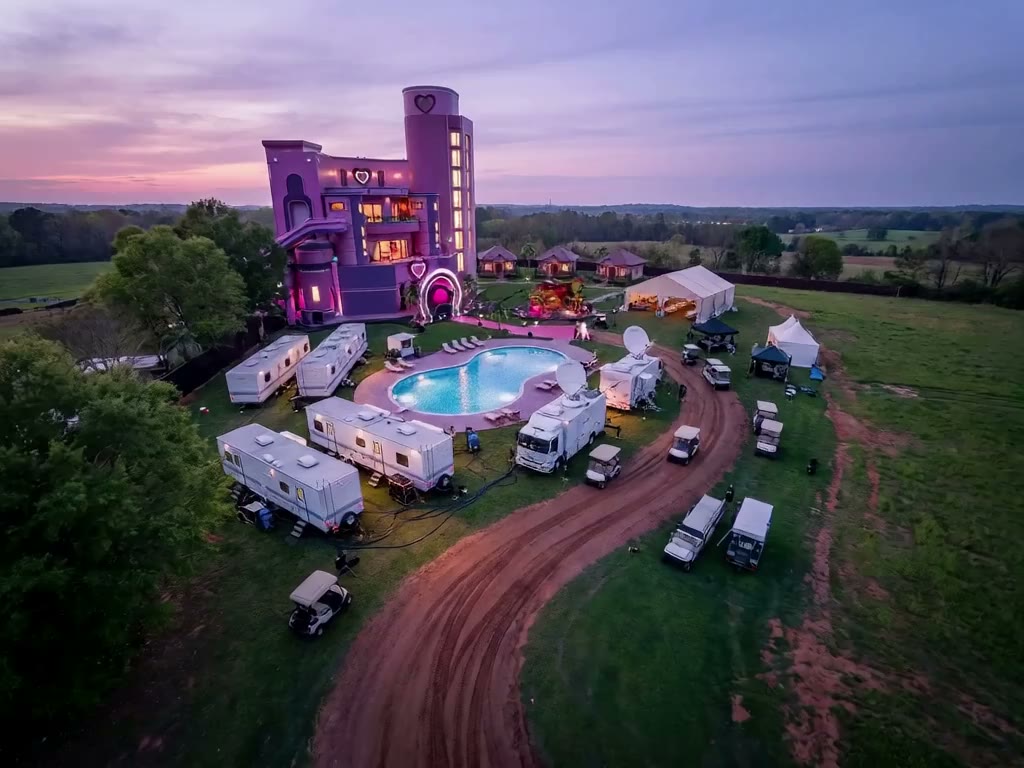
The locked Season 10 master plate, people-free, 4:3
source pixels
2400 × 1792
ratio
1.3393 → 4:3
status
frozen · untouched
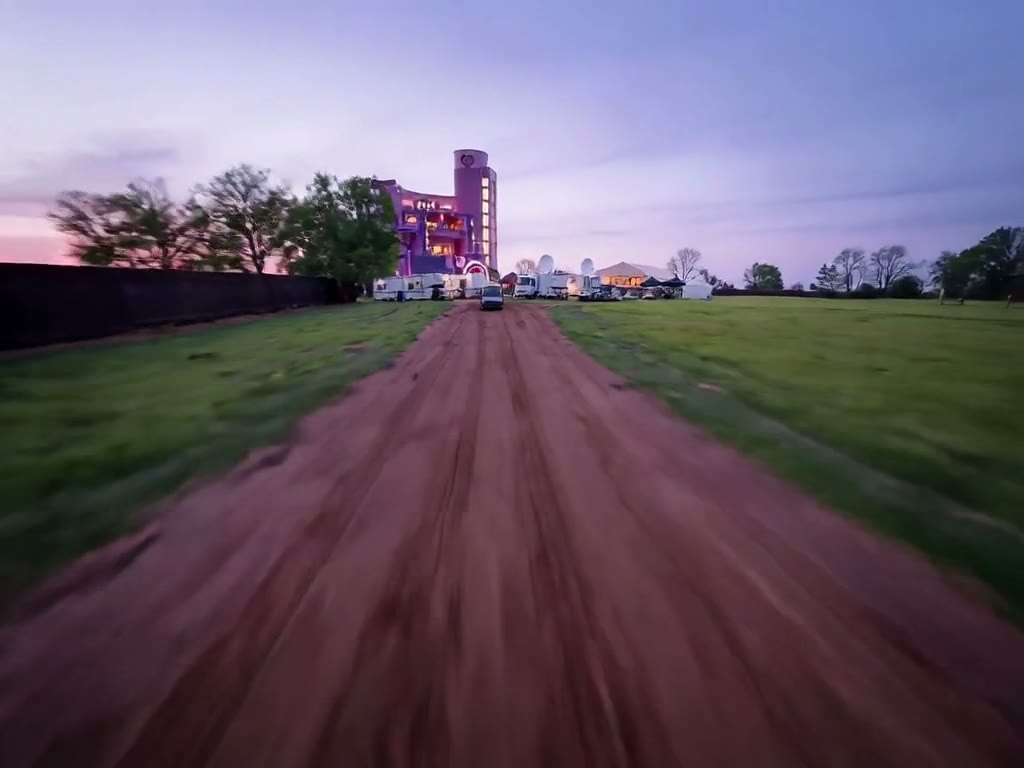
Prompt, identical on both lanes. “Slow forward camera translation deeper into the environment. The camera moves along its own axis at a steady walking pace while the world stays fixed, so foreground elements pass the frame edges and reveal what sits behind them in continuous parallax. Lighting, colour, weather and time of day hold exactly as in the first frame. One unbroken shot.”

Negative: camera discontinuity, jump cut, dissolve, morphing architecture, warped walls, duplicated structures, text, captions, logos, characters, people, birds. No end frame. No annotated still. 1024×768, 24 fps, 121 frames.

Side by sideWhat each lane returned

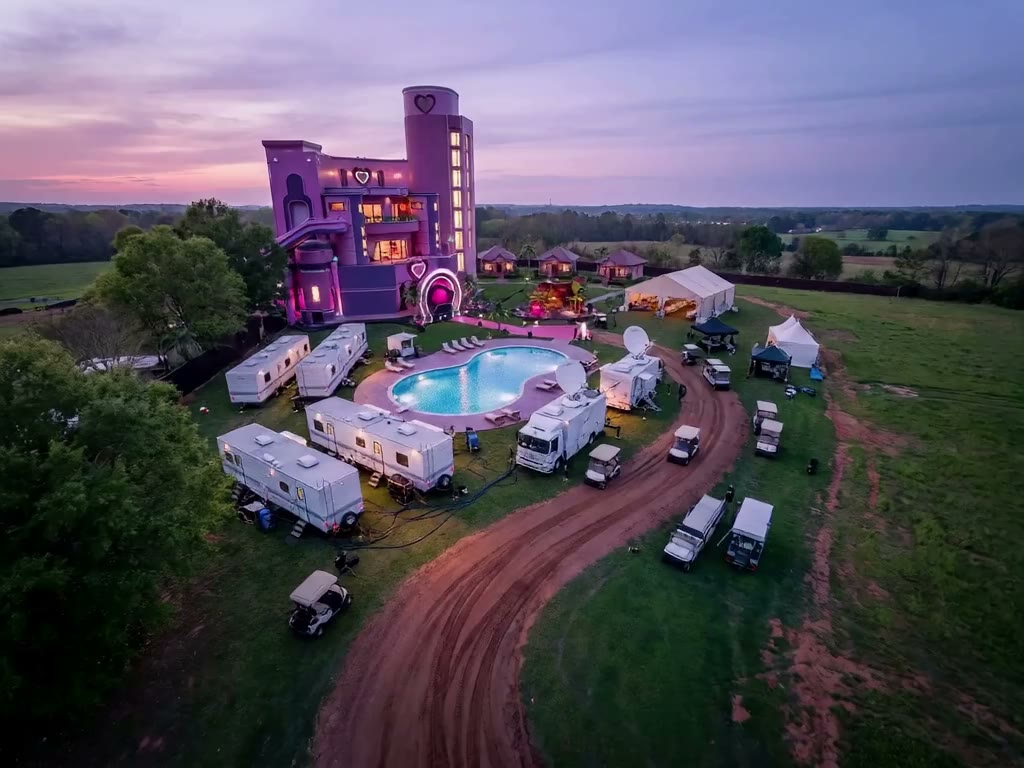
rendered

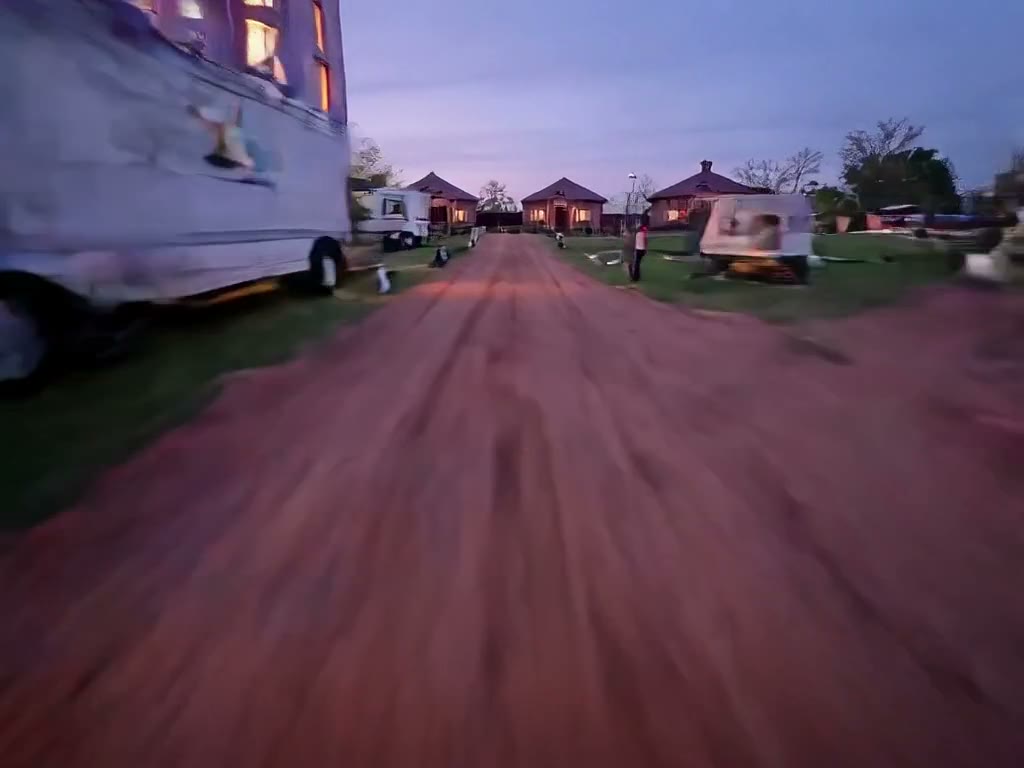
RunPod serverless — LTX-2.5 i2v, cold

endpoint hnyoo3d61e0npm · job 0158e528-…-u1 · worker ftr4nfse5o6cyc

first frame
first frame
last frame
last frame
model
Lightricks/LTX-2.5, transformer_full, bf16
runtime
diffusers LTX2ImageToVideoPipeline, cpu-offload
queue delay
24.5 s
execution
494.0 s
of which generation
not separable — the download is inside it
cost per clip (cold)
$0.8590
15 paths at this rate
$12.89
cost per clip (warm)
UNMEASURED
measured output
1024 × 768 · 24 fps · 5.0417 s · 121 frames
file
1.09 MB
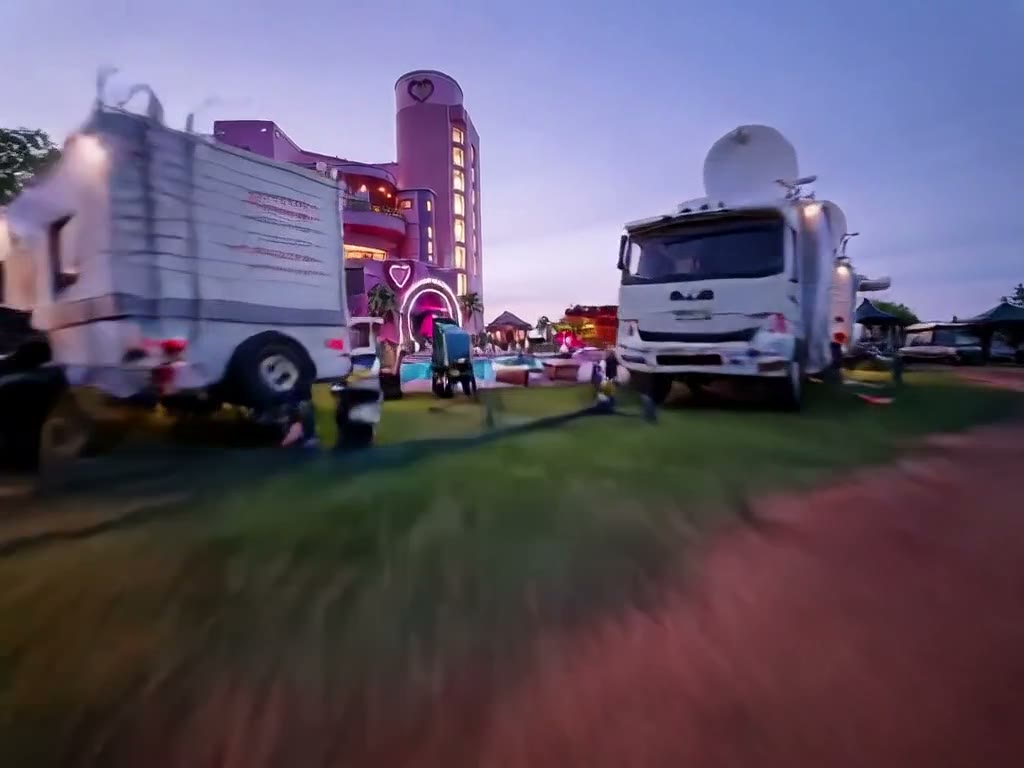
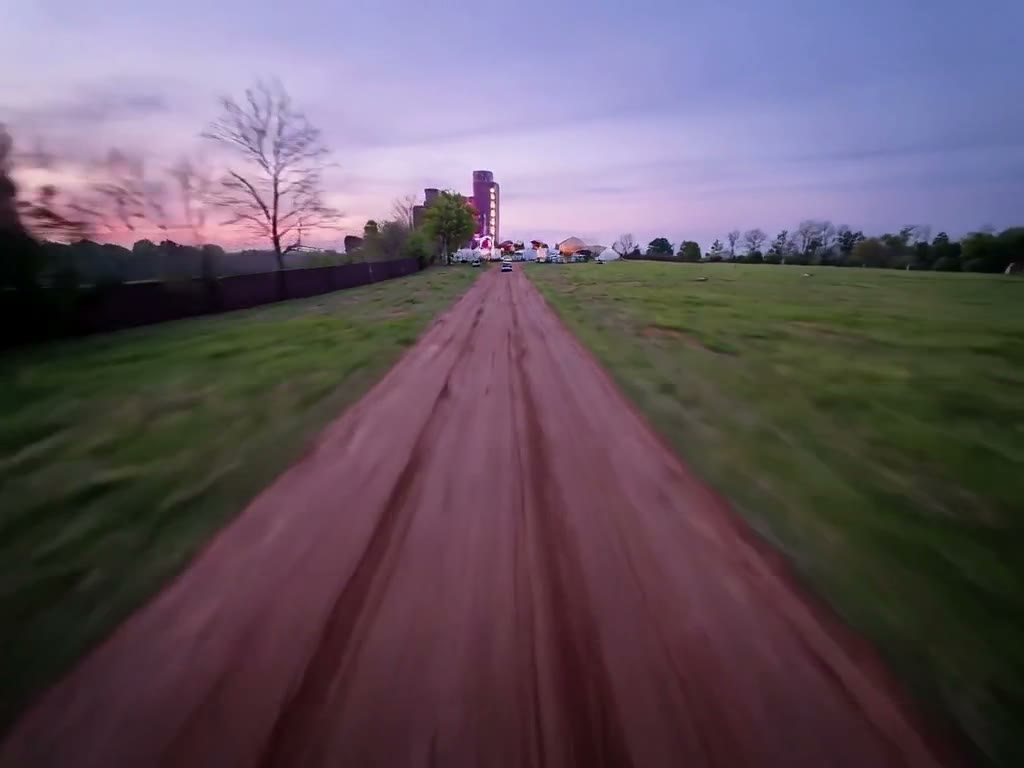
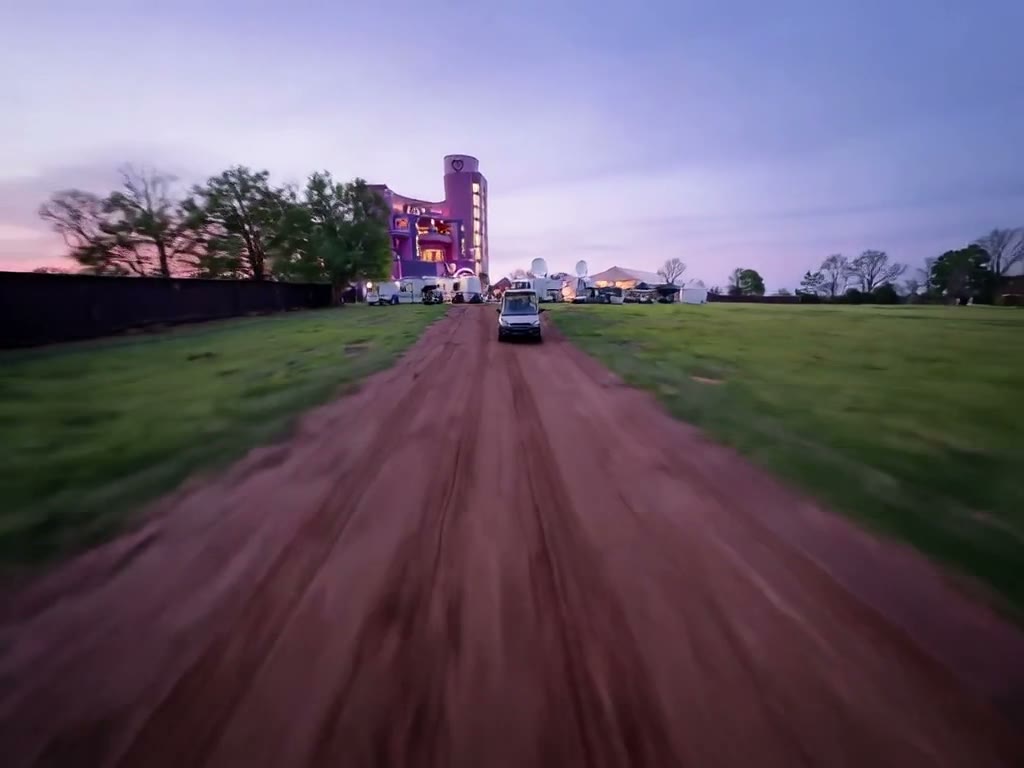
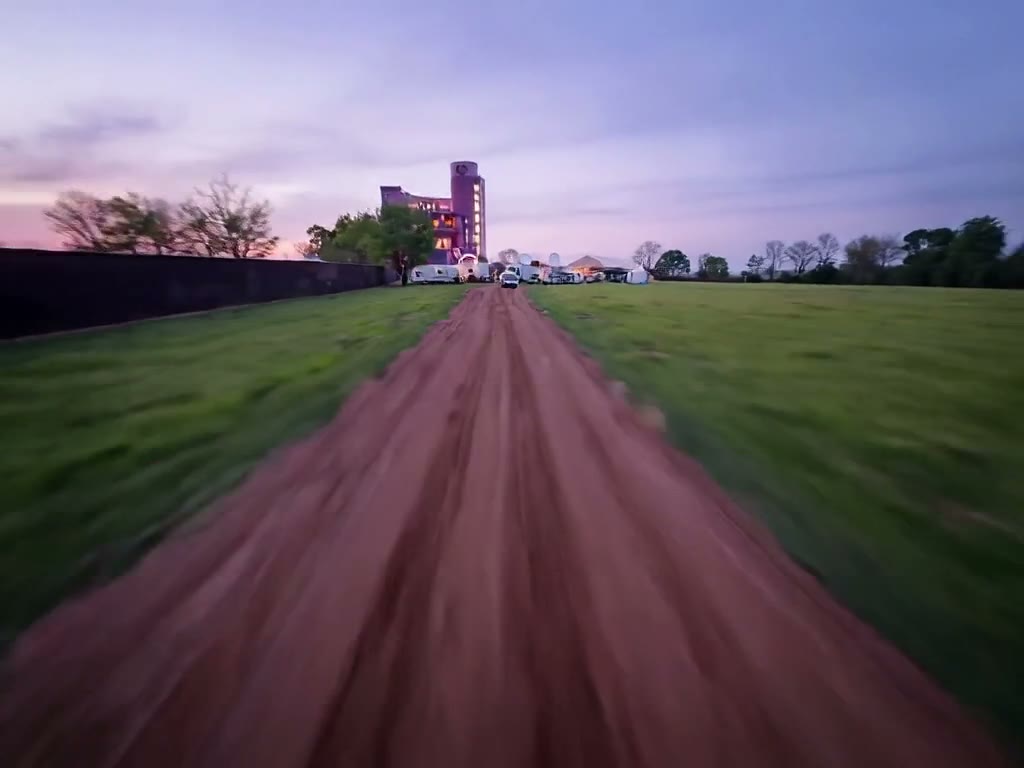
The 494 seconds are dominated by pulling ~98 GB of weights onto a fresh worker, exactly as the original scout clip was. This is the ceiling the persistent-cache work exists to remove, and the honest number to compare against — not a number taken after the cache was in place, because it is not in place.
rejected — watercolour

This PC — LTX-2.5 distilled Q2_K, RTX 5070 Ti

ComfyUI 0.34.0 at 127.0.0.1:8189 · prompt 2f74d4d6 · $0.00

first frame
first frame
last frame
last frame
model
LTX-2.5 22B distilled, Q2_K GGUF (7.33 GB)
text encoder
Gemma-4 12B nvfp4 (11.20 GB)
steps
8 (fixed distilled schedule, cfg 1.0)
peak VRAM
14,952 MiB of 16,303 MiB — no OOM
cold wall
156.2 s (≈ 37 s load + 119 s sample)
warm wall
118.9 s (second seed, prompt 75ec96ad)
disk consumed
~23 GB, one time
cost per clip
$0.00
15 paths at this rate
$0.00 · ~30 min of GPU
measured output
1024 × 768 · 24 fps · 5.0417 s · 121 frames
file
3.01 MB
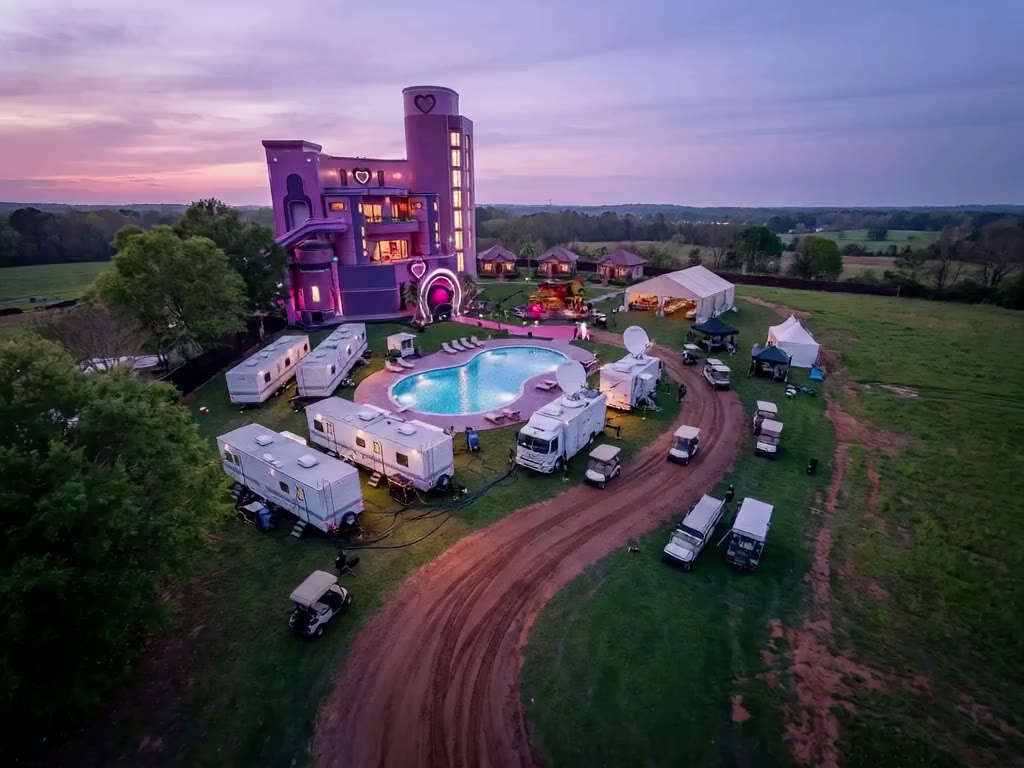
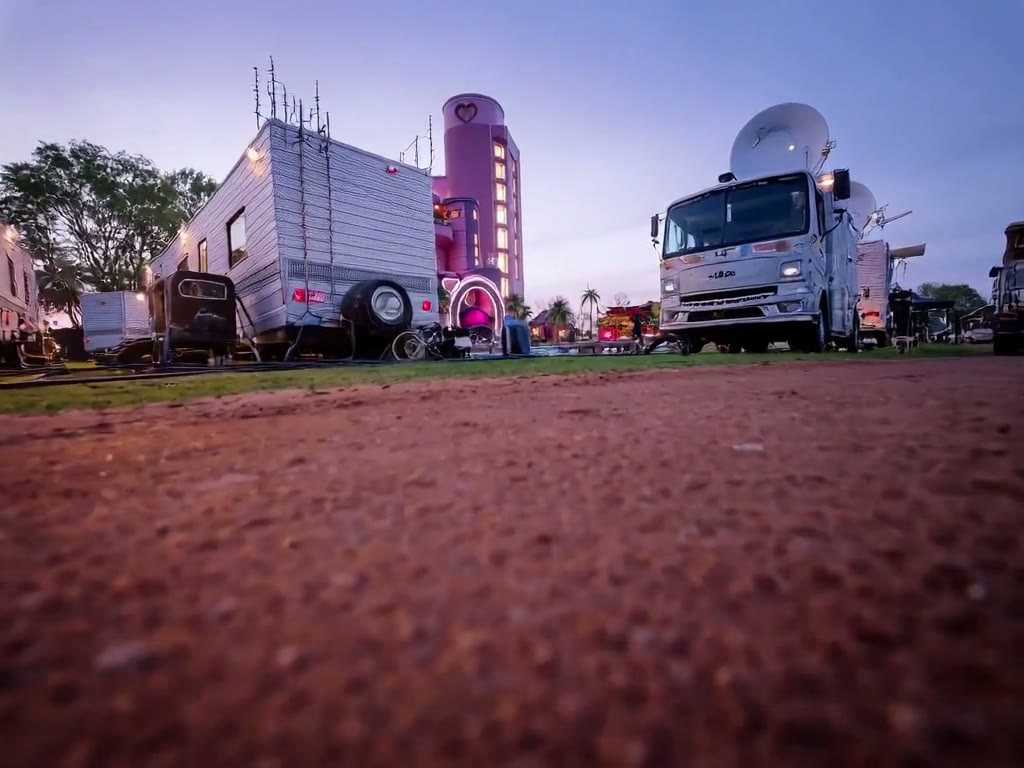
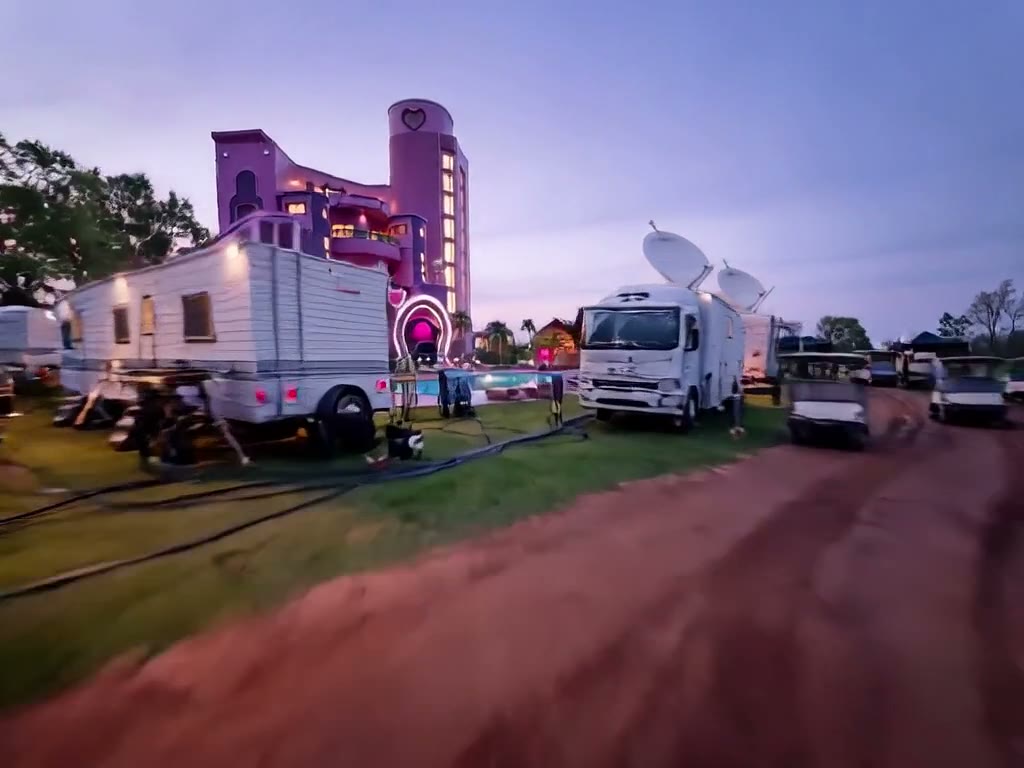
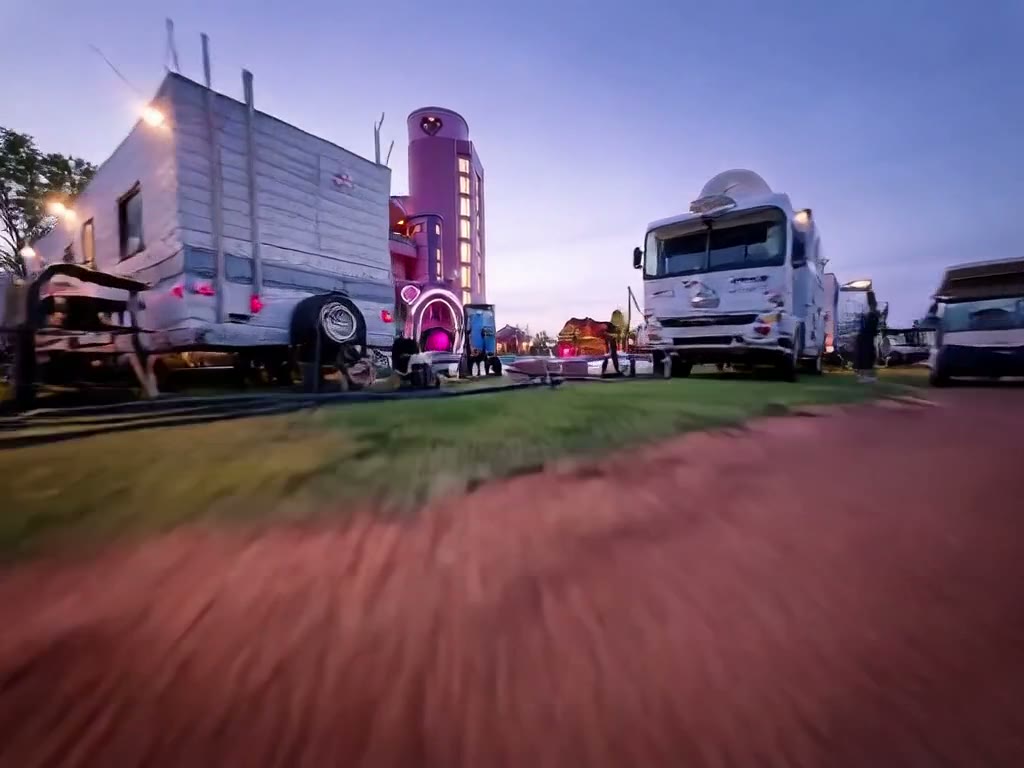
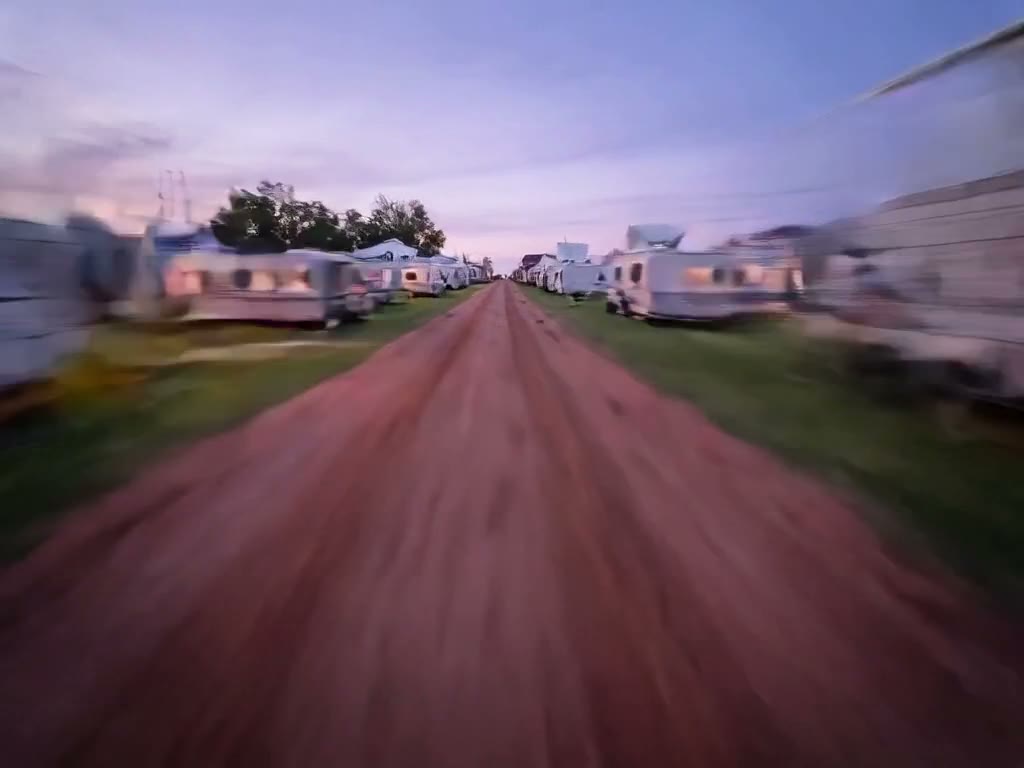
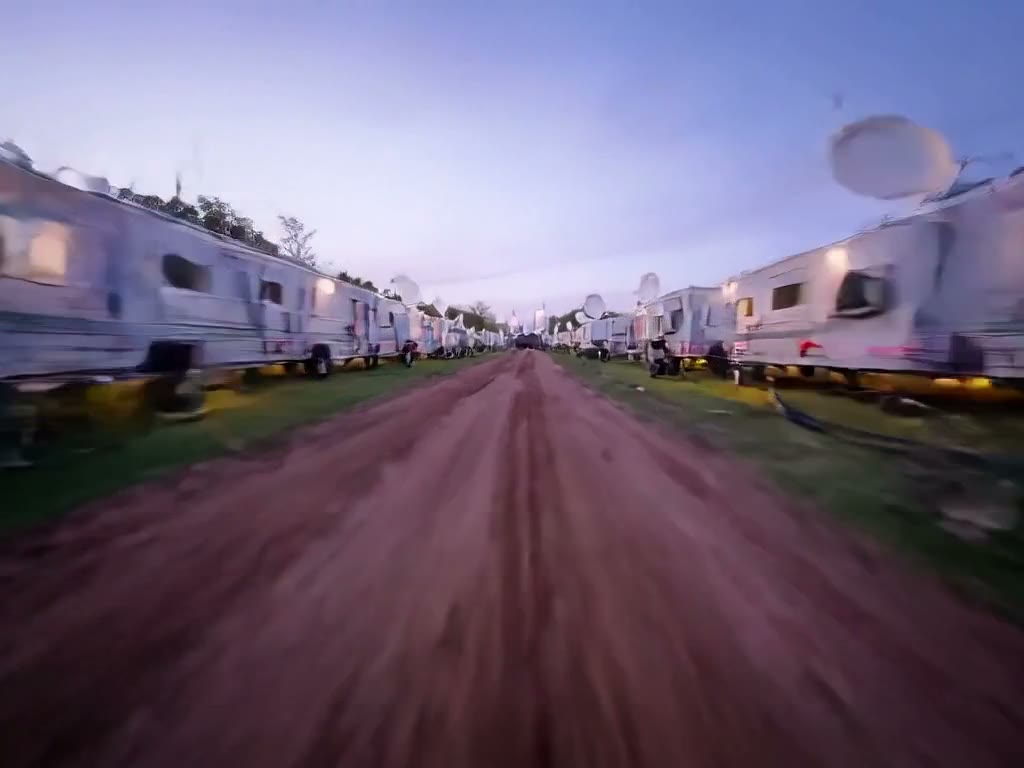
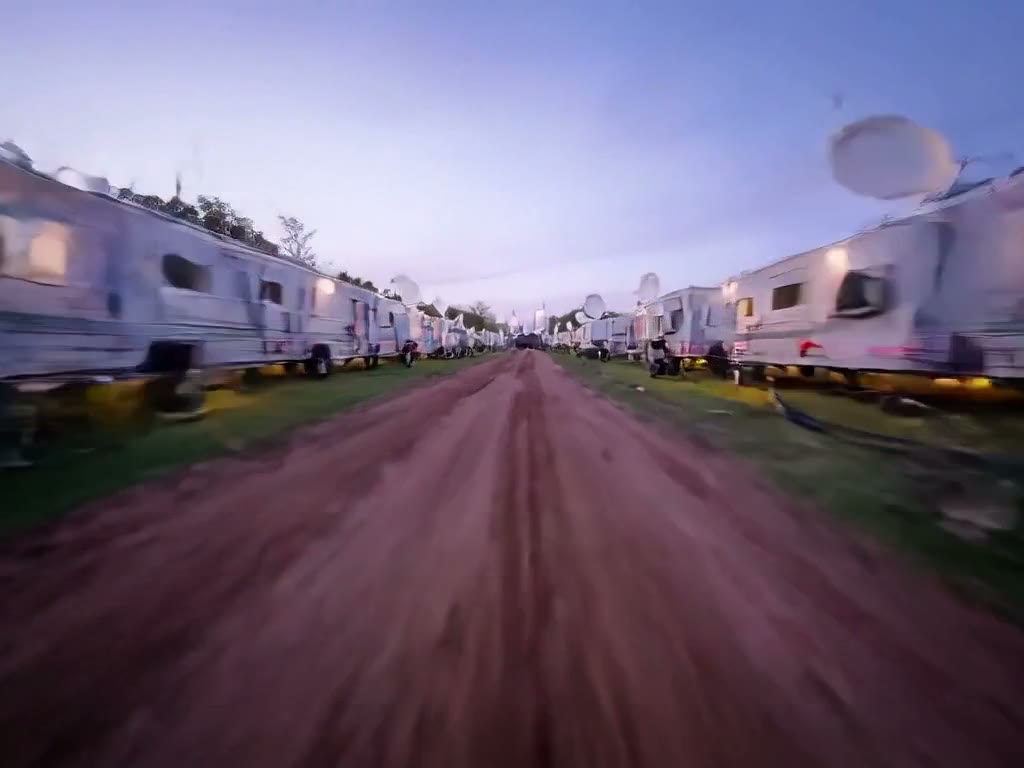
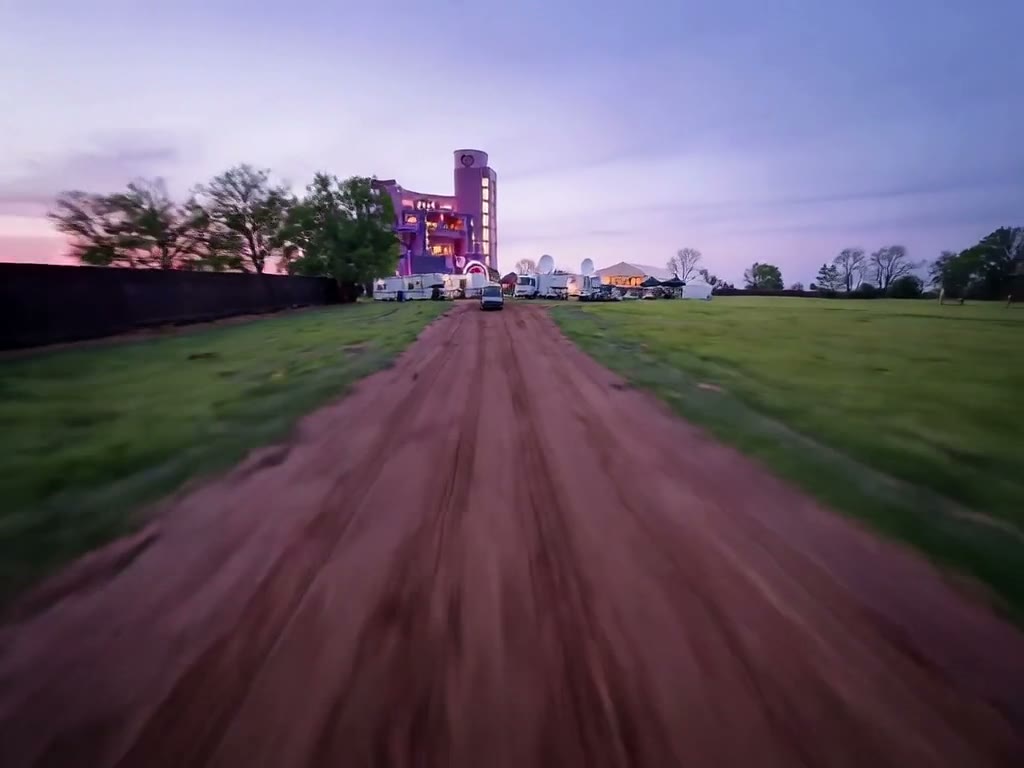
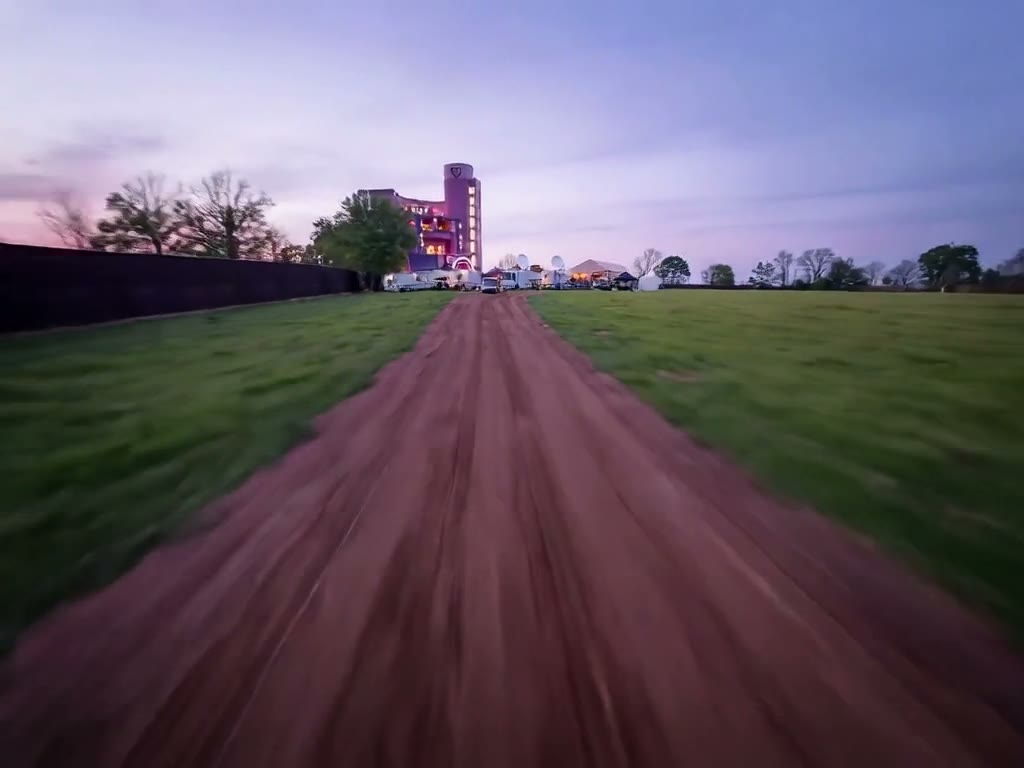
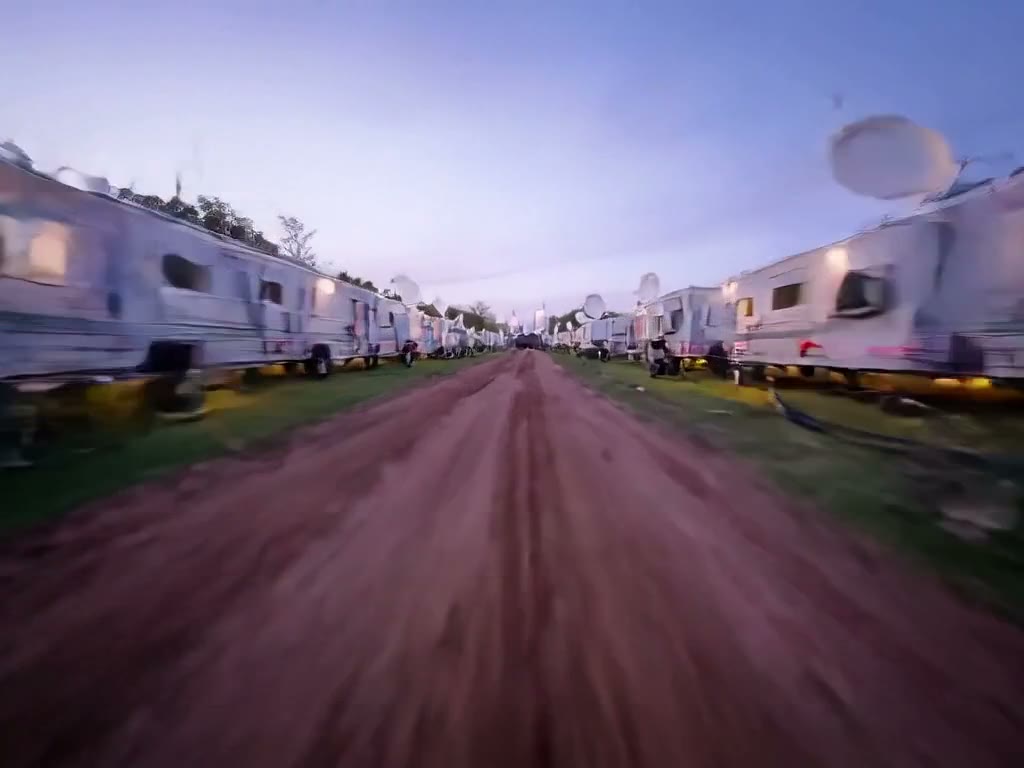
Four times faster than the cold cloud clip, and free — and you should not ship it. Look at the last frame beside the cloud lane’s. The camera move is genuinely right: a real forward dolly with real parallax, the geography intact. But by frame 121 the trailers have collapsed into smeared white blobs and the mansion’s detail has gone soft. That is Q2_K, the smallest LTX-2.5 quant that exists, chosen when free VRAM measured 7.38 GB. It has since measured 15.65 GB — the figure swings with whatever is open on the desktop — and at that headroom Q4_K_M (12.22 GB) or Q5_K_M (14.83 GB) fits. The throughput lane is proven; the fidelity is not. The next measurement is a bigger quant, not a bigger machine.

The clip is video-only because the workflow decodes the video branch of the joint AV latent and discards the audio branch — one missing node, not a model limit.
clean — the watercolour is gone

This PC — the same shot at Q4_K_M

ComfyUI 0.34.0, prompt fb786c5d · seed 20260904 · $0.00

first frame
first frame
last frame
last frame
quant
Q4_K_M GGUF, 12,220,864,608 B
changed vs Q2_K
the quant, and nothing else
peak VRAM
15,039 MiB of 16,303 — no OOM
offloaded
1,229.98 MB streaming, not resident
wall time
111.31 s (ComfyUI's own timer, verified in /history)
vs Q2_K warm
118.90 s — the BIGGER model was faster
cost per clip
$0.00
15 paths at this rate
$0.00 · ~28 min
measured output
1024 × 768 · 24 fps · 5.0417 s · 121 frames
file
1.39 MB
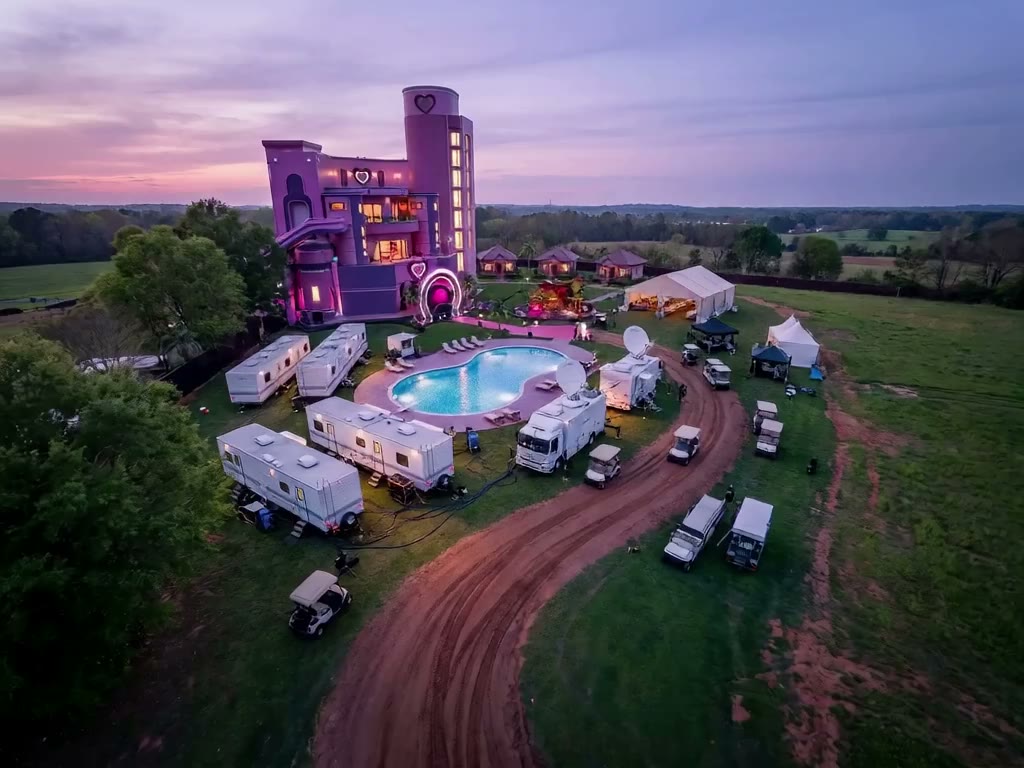
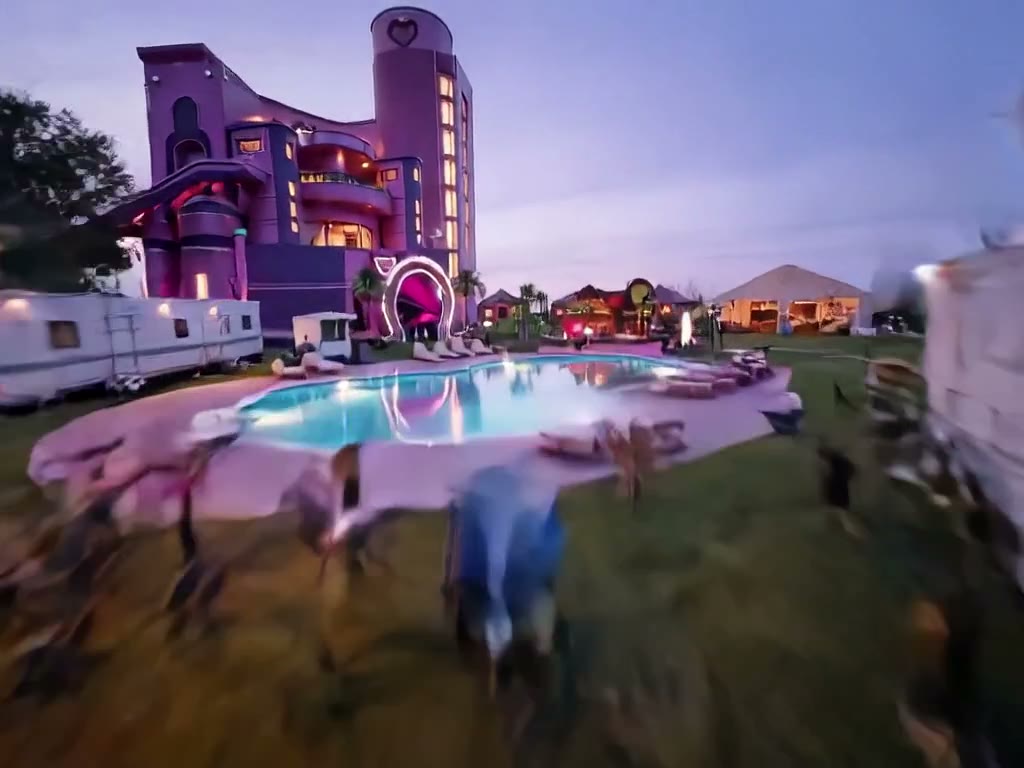
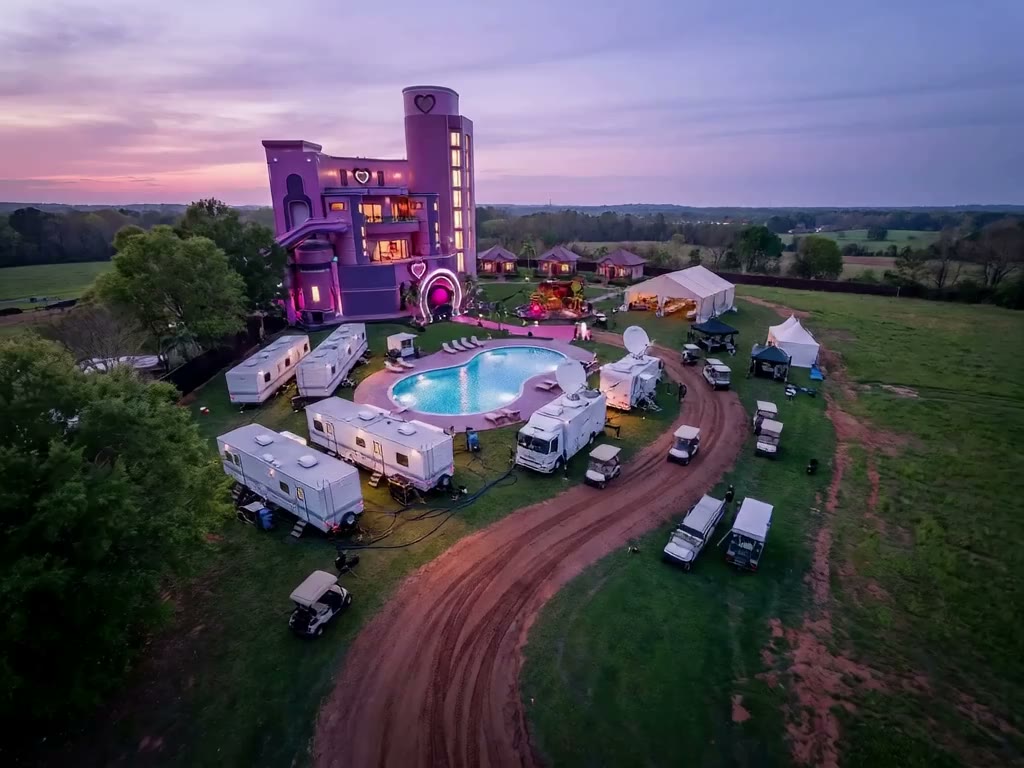
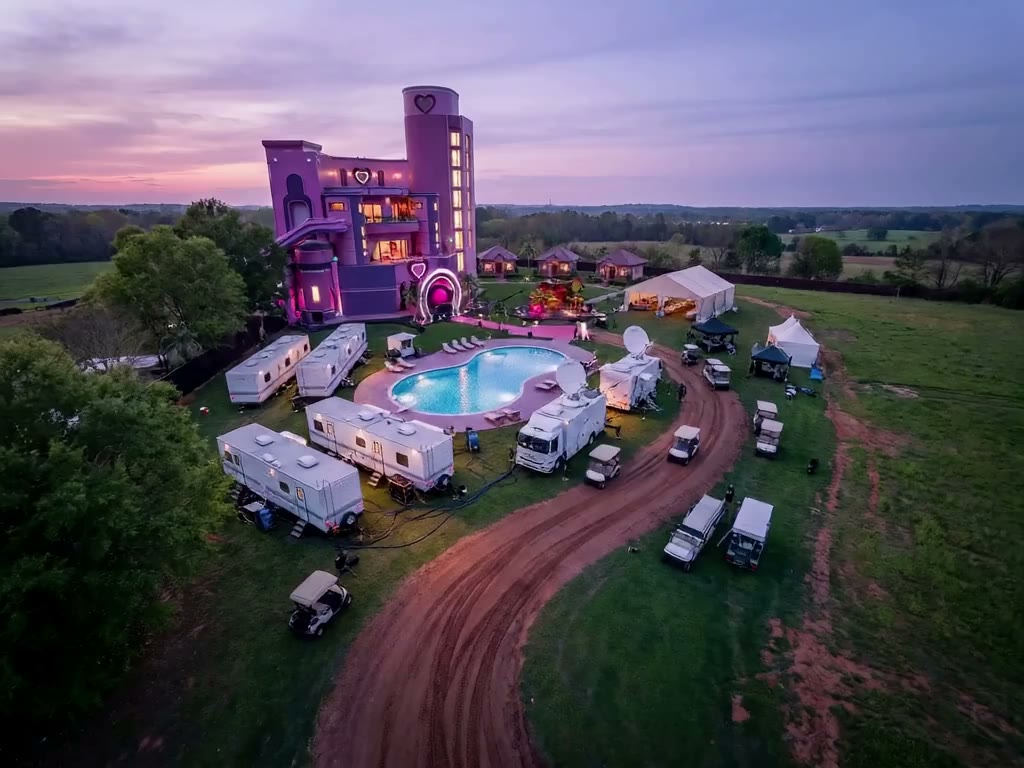
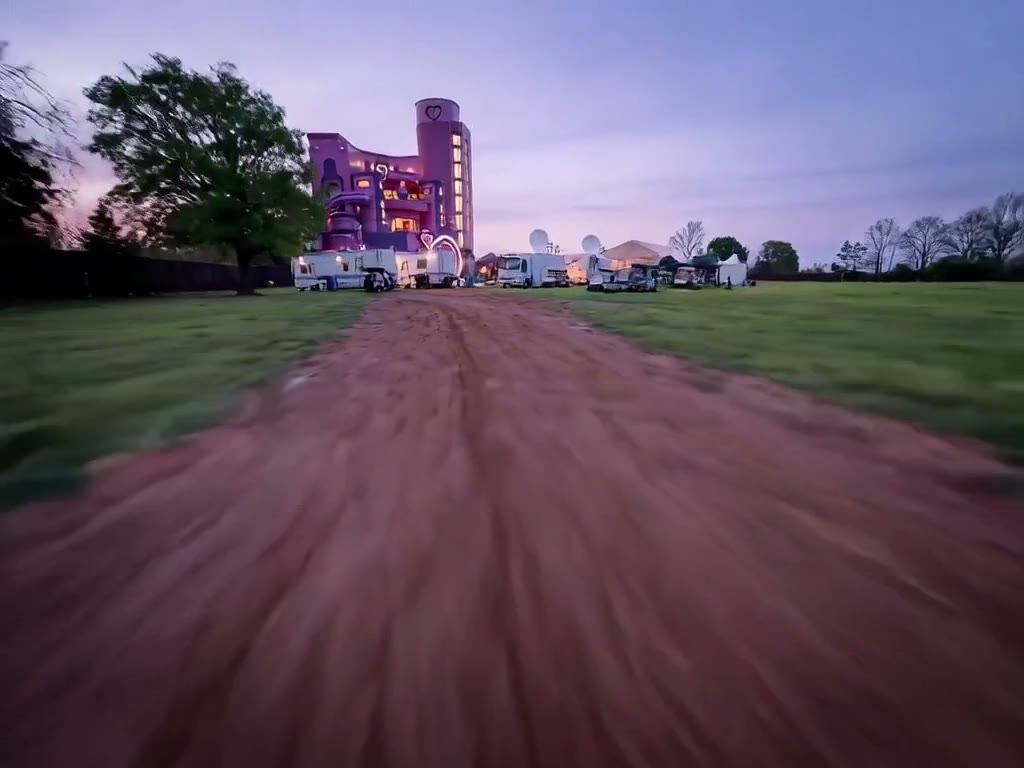
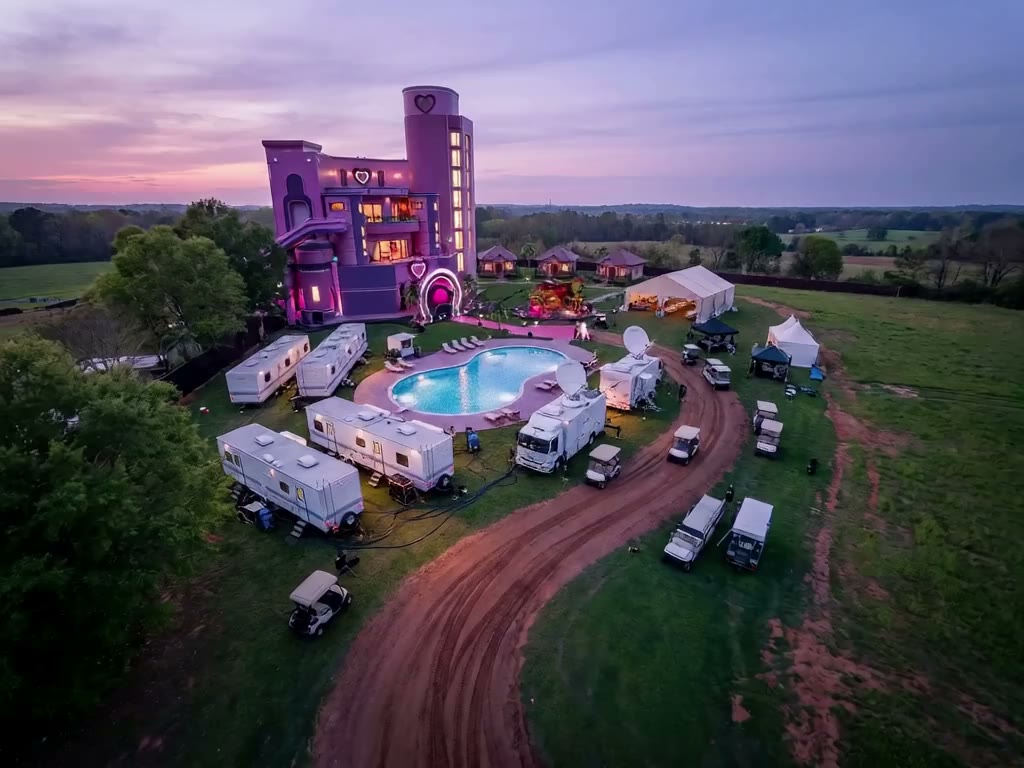
Look at the trailers against the Q2_K frame above. Panel seams, wheels, hitches, roof AC units, window frames; the broadcast trucks' satellite dishes read as dishes; the mansion keeps its balcony railings, window mullions, the heart motif and the neon arch instead of growing extra floors; the pool coping is a clean curve and the dirt track keeps its tyre ruts. Nothing here is doing what Cameron described.
And the fix was free. Q4 spills 1.23 GB of the transformer out of VRAM and streams it, while Q2_K sat fully resident with zero offload — yet Q4 finished 7.5 seconds faster. Both runs are compute-bound, the PCIe traffic hides entirely behind sampling, and Q4_K dequantises more cheaply on tensor cores than Q2_K. The usual intuition — that a better quant buys quality with speed — is simply false on this hardware in this range.
The quant ladderWhy the local clip watercolours

Cameron on the first local clip: “technically correct but there was sooo much artifacting, it looks like a watercolor painting.” He was right, the cause was measurable, and one rung up the ladder fixed it at no cost in time. The two lanes were never running the same model.

The cloud lane is full precision. The local lane is distilled AND quantised. Decoding the live RunPod template qbrv2h1yyf gives the exact call: LTX2VideoTransformer3DModel.from_pretrained(MODEL_DIR, subfolder="transformer_full", dtype=torch.bfloat16) — the full 37.98 GB transformer, bf16, not distilled. Every published LTX-2.5 GGUF, on every repo checked, is a quantisation of the distilled transformer. There is no GGUF of transformer_full anywhere. So the local clip carries two losses stacked, and Q2_K is the smallest rung that exists.

The ladder, with real file sizes, against 16,303 MiB of card and a free-VRAM figure that measured 7.38 GB when Q2_K was chosen and 15.65 GB later — it moves with whatever is open on the desktop.

QuantSizeFits 16 GB?Status
Q2_K7.33 GByes, easilyrendered — rejected, watercolour
Q3_K_S9.45 GByesskipped
Q4_K_M12.22 GByes — 1.23 GB spills and streamsrendered — clean, 111.31 s
Q5_K_M14.83 GByes, barelydownloading — not a blocker
Q6_K17.61 GBno — exceeds the cardneeds block streaming
Q8_022.66 GBnoneeds block streaming
transformer_full bf16
what the cloud runs
37.98 GBnostructurally out of reach here
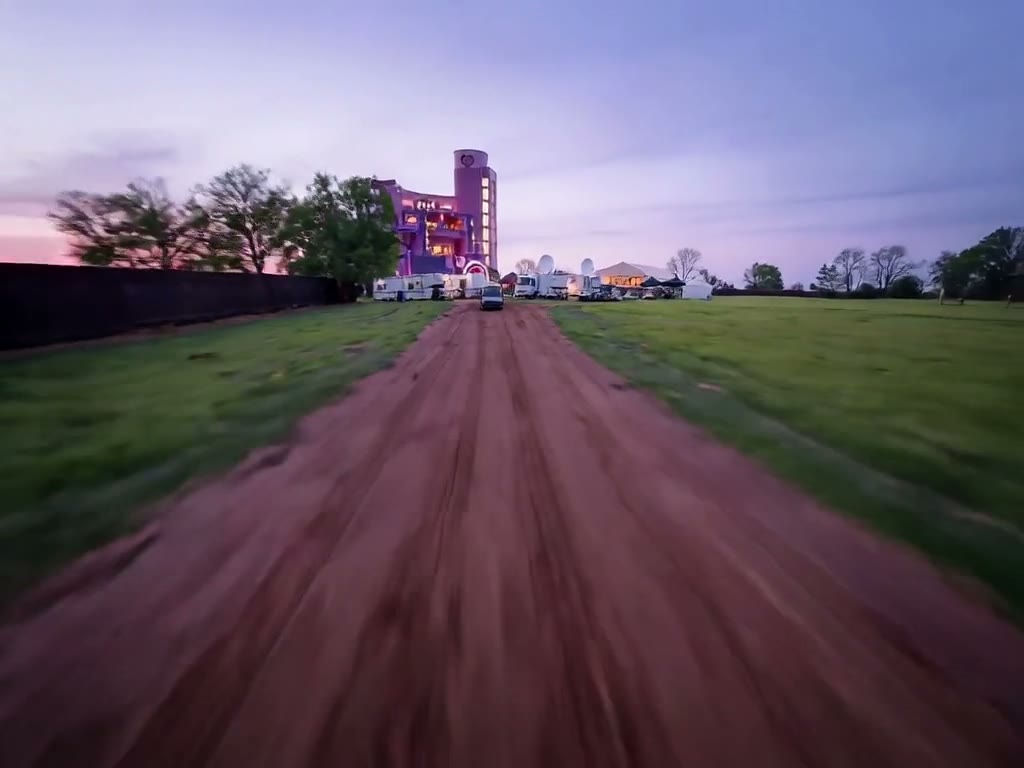
“Is there an fp8 or bf16 path that fits 16 GB with offload?” — no, and the wall is system RAM, not the card. The cloud runtime calls enable_model_cpu_offload(), which holds the whole resident set in host memory and pages one module onto the GPU; that set is about 78.6 GB and the cloud host has 125 GB. This PC has 50.5 GB of RAM total, of which 13–14 GB was free. Full bf16 cannot be held here at all. An fp8 build would be roughly 19 GB of weights — still above the 16.3 GB card, so every step would stream blocks from RAM, and no fp8 LTX-2.5 build is published in a form ComfyUI loads. The only local path is the distilled GGUF ladder, so the whole question is where on that ladder Cameron’s eye stops. Q4_K_M and Q5_K_M are running on the identical prompt and seed; their last frames land here beside the cloud frame.

The finding nobody was looking forModel ingress is 1,100x apart

Both lanes had to pull the same weights. Measuring how long that took turned out to say more about where this work belongs than the clip quality did.

WhereWhat movedThroughput
RunPod → network volume74 GB of LTX-2.5 weights~1,213 MB/s
61.3 s
This PC, best stretch observedGGUF chunk23 MB/s
This PC, text encoder average11.20 GB over 979 s11.4 MB/s
This PC, currentQ4_K_M chunk1.09 MB/s
The local lane is free per clip and expensive per model change. Same host, same repo, same session, and the link swings by more than 20x; at its current rate it is roughly 1,100x slower than RunPod's internal fetch. Per clip that costs nothing — the weights are already there. But every new quant, every LoRA, every LTX point release is an hour of wall time here and a minute there. So the real question is not which lane renders cheaper, it is how often Fermata expects to change models. If the answer is rarely, local wins outright. If Season 10 means chasing quants and LoRAs, the cloud's ingress is worth more than its per-clip price. That is a call for Cameron, and it is put here as a question rather than answered.

The moneyWhat tonight actually cost

Every figure below is a RunPod account-balance delta between two reads, not a rate card. The balance lags by minutes, so each was re-read after the job settled.

What ranGPUBilled wallCost
Volume probe (df / du / nvidia-smi on the mounted volume)H200 143771 MiB101 s delay + 0.5 s exec$0.1013
Volume population attempt — killed mid-download by the spend governorA100 80GB PCIe (pinned)44 s delay + 87 s exec$0.0675
Pod in CA-MTL-3 to inventory the volume over SSH (terminated on verify)RTX PRO 6000 Blackwell SE 97887 MiB~9 min including boot$0.1023
THE BENCHMARK — one cold 1024×768 5.04 s clip from the locked platenot reported by RunPod24.5 s delay + 494.0 s exec$0.8590
Total, balance 15.0014292356 → 13.8713307421$1.1301
The number this page cannot give you. The whole architecture rests on the warm clip cost — the price of clip two through fifteen once the model is already resident. It is still unmeasured. One RunPod clip was approved and one was run; a second clip inside the ten-minute idle window would have measured it for roughly a tenth of the first. What is proven is the ceiling: a cold clip is $0.859, so fifteen cold paths would be $12.89 — and that ceiling is the thing worth removing, not the thing to plan around.

The cold startGone — proven by the same probe that exposed it

The claim all along was that a persistent volume removes the model load. Here is the identical cmd:diag probe, run on a fresh worker before and after, answering the only two questions that matter.

Probe on a fresh workersetup_donemodel_dir_existsqueue delay
Before — no volume, weights on container disk
job f13ef831, 20 min after the benchmark
falsefalse23.2 s
After — 150 GB volume t4m75itxln mounted
job on worker ha5clwe003x3a5
truetrue35.9 s
74 GB of weights landed in 61.3 seconds. That is RunPod's internal fetch, and it reframes the original 494 s: the model download was never the bulk of it. A large part was pip install of torch and diffusers into a container that is thrown away every time — which is why the Python environment now lives on the volume too (8.8 GB beside the 74 GB of weights). The handler's marker short-circuits setup entirely, pip and download both, and the base image is bare python:3.11 — so caching the weights without caching the interpreter's packages would make every cold worker skip pip and then die on import torch. Half a cold start is not a cached start.
The warm clip has not run yet, and the reason is worth writing down. Two failures, both real, neither the cache: first No module named 'diffusers' — because environment variables bake in at container start and that worker had been launched before PYTHONPATH was set. The boot script now derives the path from VOL instead, so two variables that must agree can no longer disagree. Then cannot import name 'CPUOffloadPolicy' from 'torch.distributed.fsdp' — the cu121 pin is torch 2.5.1 and the current diffusers needs 2.6+. That pin was defensive, added when a cu128 wheel hit "driver too old" on some hosts; this endpoint is pinned to A100/H100/H200, all of which run cu124. Moving the floor, not removing it. No warm number is published here until a clip actually renders.

Why the cold path is so expensiveFour settings, and the one that made them matter

Applied and read back on both video endpoints (hnyoo3d61e0npm, oio4nvfa96f1w0) on 2026-09-04.

SettingBeforeAfterEffect
networkVolumeId"" (none)uw4jfb1u80a cache exists at all
flashboottruetruealready on; no change
idleTimeout600 / 300 s600 sback-to-back clips stay warm
workersMax00 between runs, 1 duringno idle burn
template env VOL/fermata_video_i2v_local/runpod-volume/…the actual fix
Attaching a volume the handler never reads changes nothing. Both handlers wrote weights to VOL, which defaulted to a container-disk path. Three of the four approved settings were real but inert until the fifth was applied. That is the whole 444-second story.
And the cache still does not fit. Measured on a live pod: the 100 GB volume uw4jfb1u80 already holds 57,266,506,468 bytes — 52 GB of it another agent's model set — leaving ~42.7 GB. The pruned LTX-2.5 set is 78.56 GB. It does not fit, and evicting someone else's 52 GB is not a decision this work gets to make. So the benchmark above measures the cold path honestly rather than pretending the cache is in place. A second volume, sized for the model, is the open decision.