Love Bird · Season 10 · environment pipeline
Two lanes, one shot.
Same plate. Same prompt. Same 5 seconds.
The opening scout clip took 537 seconds of billed GPU to produce five seconds of video. That was never generation time — it was a 98 GB model download, repaid from scratch on every cold worker. This page puts the two candidate lanes side by side on the identical shot so the choice is made on measured numbers.
The shotDeparting the locked master plate
Composer environment 1ba70902, locked people-free master plate f6c6d570. Source is 2400×1792 — a 4:3 frame, resized proportionally to 1024×768. Never stretched, never relabelled.
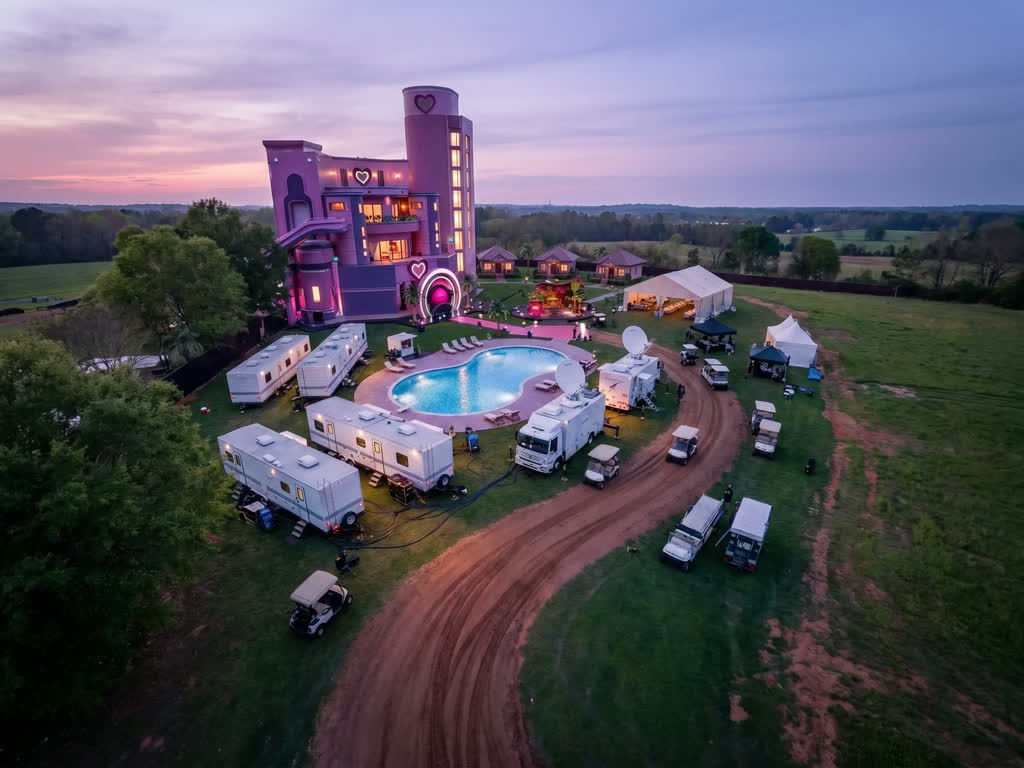
- source pixels
- 2400 × 1792
- ratio
- 1.3393 → 4:3
- status
- frozen · untouched
Negative: camera discontinuity, jump cut, dissolve, morphing architecture, warped walls, duplicated structures, text, captions, logos, characters, people, birds. No end frame. No annotated still. 1024×768, 24 fps, 121 frames.
Side by sideWhat each lane returned
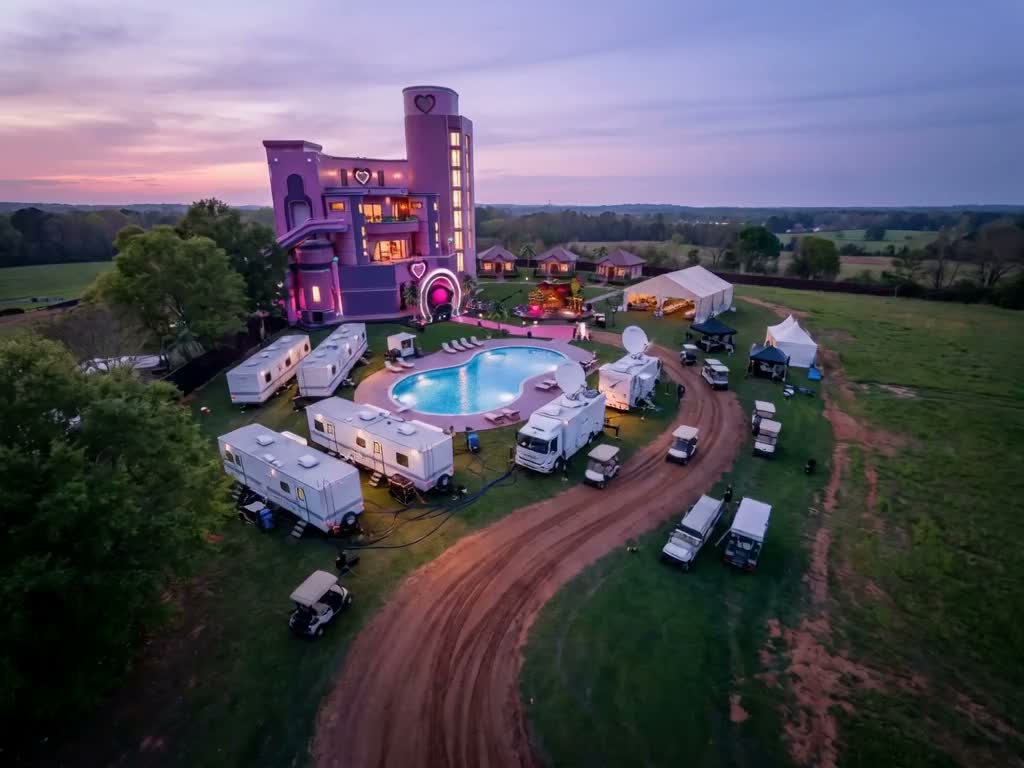
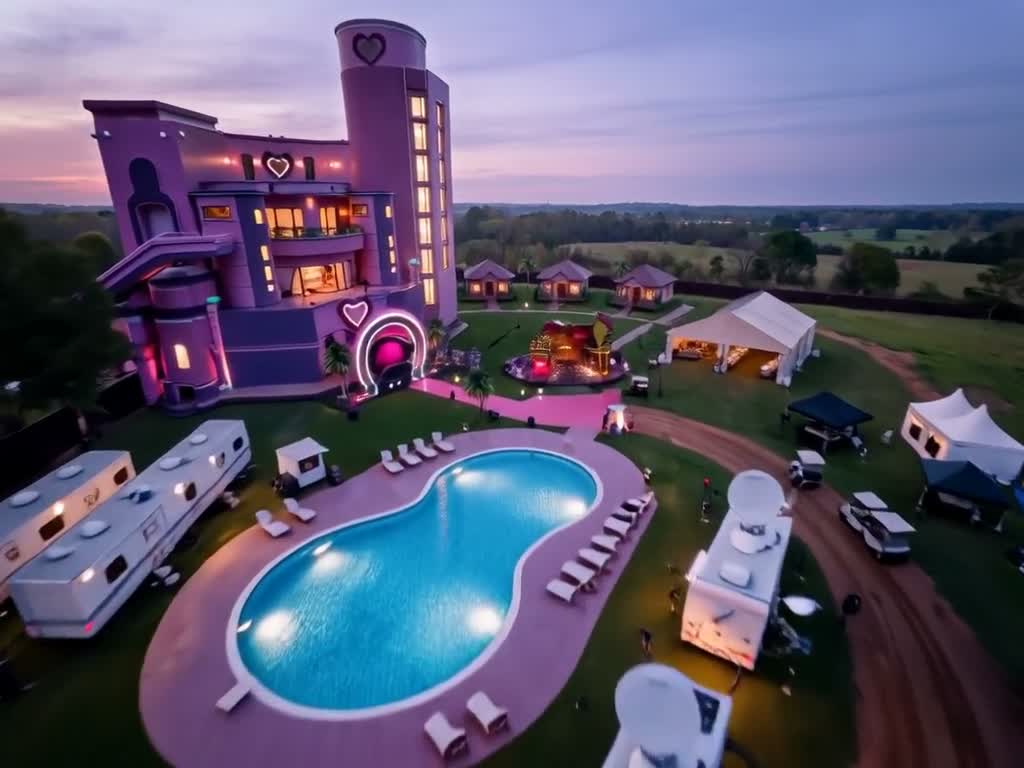
RunPod serverless — LTX-2.5 i2v, cold
endpoint hnyoo3d61e0npm · job 0158e528-…-u1 · worker ftr4nfse5o6cyc
- model
- Lightricks/LTX-2.5, transformer_full, bf16
- runtime
- diffusers LTX2ImageToVideoPipeline, cpu-offload
- queue delay
- 24.5 s
- execution
- 494.0 s
- of which generation
- not separable — the download is inside it
- cost per clip (cold)
- $0.8590
- 15 paths at this rate
- $12.89
- cost per clip (warm)
- UNMEASURED
- measured output
- 1024 × 768 · 24 fps · 5.0417 s · 121 frames
- file
- 1.09 MB
The moneyWhat tonight actually cost
Every figure below is a RunPod account-balance delta between two reads, not a rate card. The balance lags by minutes, so each was re-read after the job settled.
| What ran | GPU | Billed wall | Cost |
|---|---|---|---|
| Volume probe (df / du / nvidia-smi on the mounted volume) | H200 143771 MiB | 101 s delay + 0.5 s exec | $0.1013 |
| Volume population attempt — killed mid-download by the spend governor | A100 80GB PCIe (pinned) | 44 s delay + 87 s exec | $0.0675 |
| Pod in CA-MTL-3 to inventory the volume over SSH (terminated on verify) | RTX PRO 6000 Blackwell SE 97887 MiB | ~9 min including boot | $0.1023 |
| THE BENCHMARK — one cold 1024×768 5.04 s clip from the locked plate | not reported by RunPod | 24.5 s delay + 494.0 s exec | $0.8590 |
| Total, balance 15.0014292356 → 13.8713307421 | — | — | $1.1301 |
Why the cold path is so expensiveFour settings, and the one that made them matter
Applied and read back on both video endpoints (hnyoo3d61e0npm, oio4nvfa96f1w0) on 2026-09-04.
| Setting | Before | After | Effect |
|---|---|---|---|
| networkVolumeId | "" (none) | uw4jfb1u80 | a cache exists at all |
| flashboot | true | true | already on; no change |
| idleTimeout | 600 / 300 s | 600 s | back-to-back clips stay warm |
| workersMax | 0 | 0 between runs, 1 during | no idle burn |
| template env VOL | /fermata_video_i2v_local | /runpod-volume/… | the actual fix |
VOL, which defaulted to a container-disk path. Three of the four approved settings were real but inert until the fifth was applied. That is the whole 444-second story.
uw4jfb1u80 already holds 57,266,506,468 bytes — 52 GB of it another agent's model set — leaving ~42.7 GB. The pruned LTX-2.5 set is 78.56 GB. It does not fit, and evicting someone else's 52 GB is not a decision this work gets to make. So the benchmark above measures the cold path honestly rather than pretending the cache is in place. A second volume, sized for the model, is the open decision.